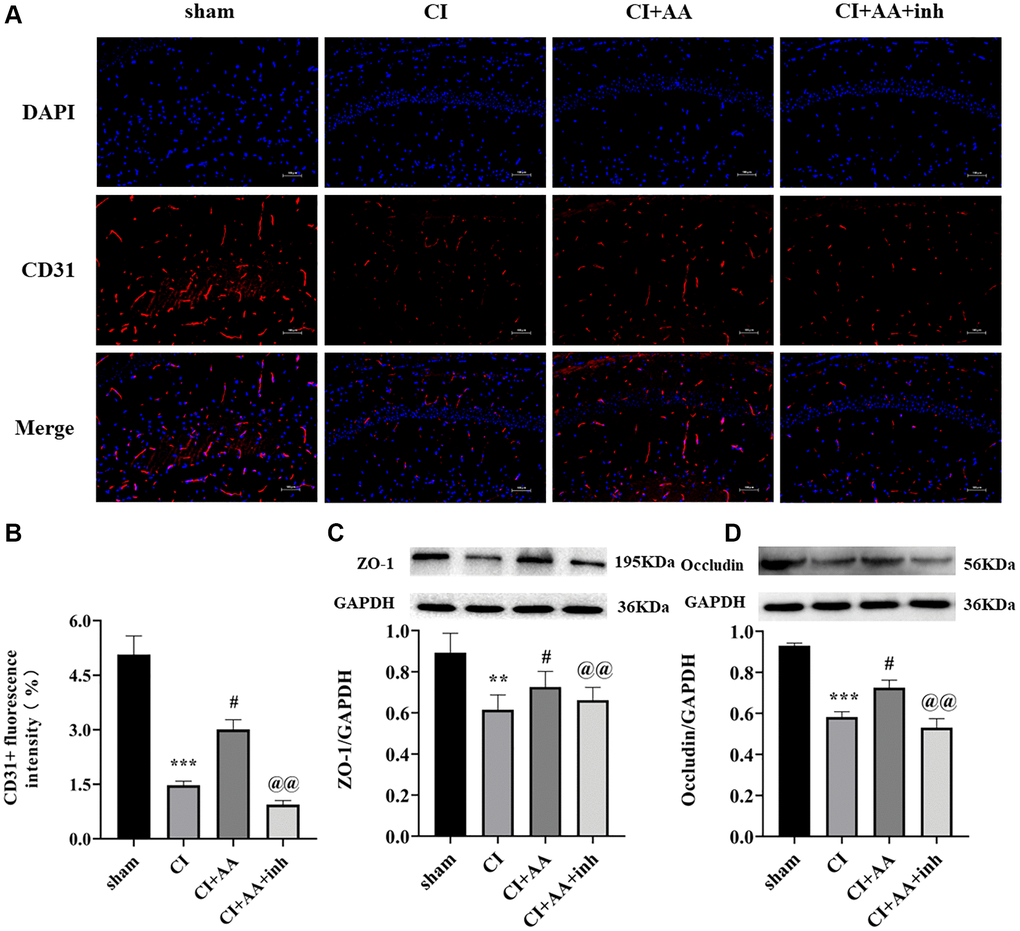
Figure 5.Alisol A upregulated the expression of CD31, ZO-1 and Occludin after CI. (A) Representative image of CD31 in the hippocampal CA1 region by using immunofluorescence staining. 200×, scale bar is 100 μm. (B) Quantitative analysis of CD31 fluorescence intensity. n = 3. (C) Western blot showing the expression of ZO-1 and quantitative analysis of the ratio of ZO-1 to GAPDH. (D) Western blot showing the expression of Occludin and quantitative analysis of the ratio of Occludin to GAPDH, n = 4. Data are shown as the mean ± SD. **P < 0.01, ***P < 0.001 compared with the sham group, #P < 0.05 compared with the CI group, @@P < 0.01 compared with the CI+AA group.