Submit an Article
Navigate
Home
Editorial Board
Editorial Policies
Current Volume
Archive
Scientific Integrity
Publication Ethics Statements
Interviews with Outstanding Authors
Newsroom
Sponsored Conferences
Podcast
Contact
Special Collections
Submit an Article
Online ISSN: 1945-4589
Research Paper
|
Volume 15, Issue 20
|
pp. 11571–11587
Metabolic and senescence characteristics associated with the immune microenvironment in non-small cell lung cancer: insights from single-cell RNA sequencing
Back to article
Figure 3
(3 of 9)
−
100%
+
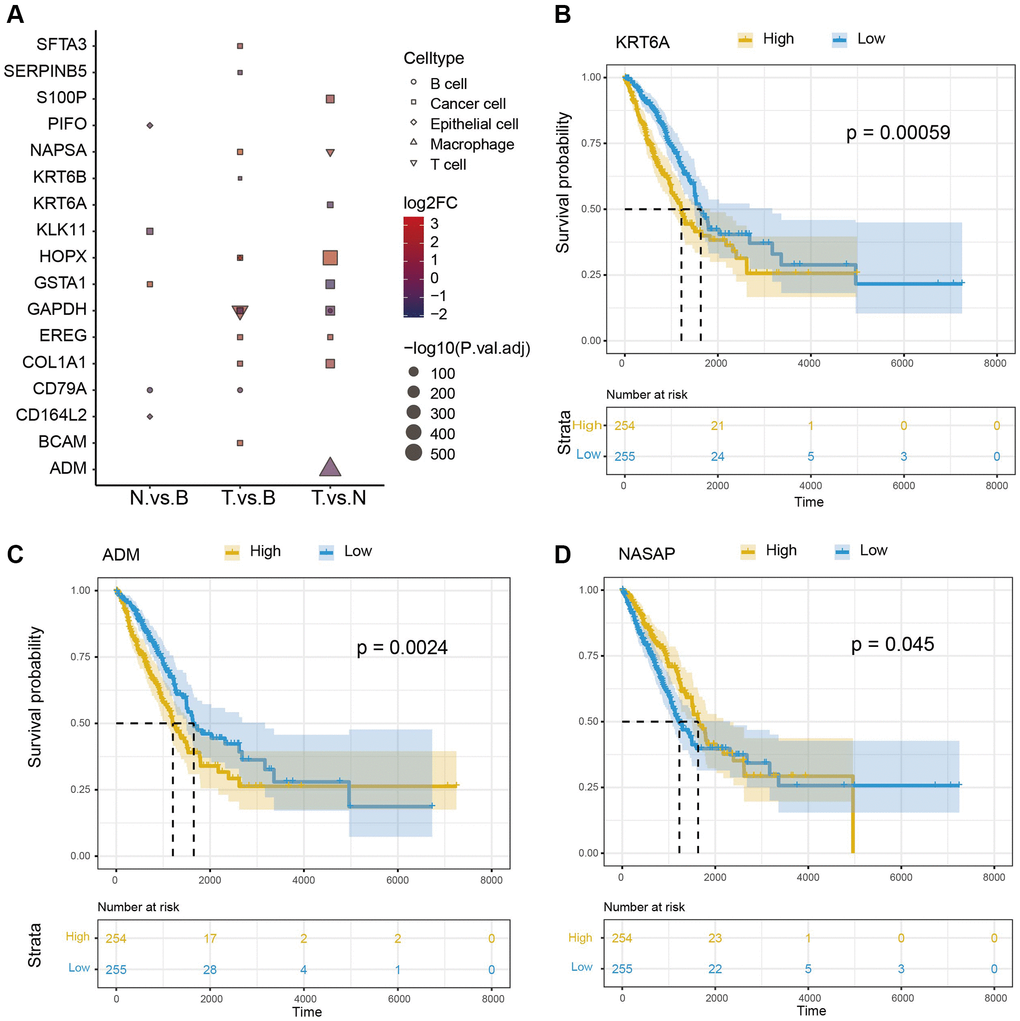
Figure 3.
Survival analysis of cell marker genes.
(
A
) DEGs between different groups. (
B
–
D
) Survival analysis of 3 representative marker genes (KRT6A, NASPA, and ADM).