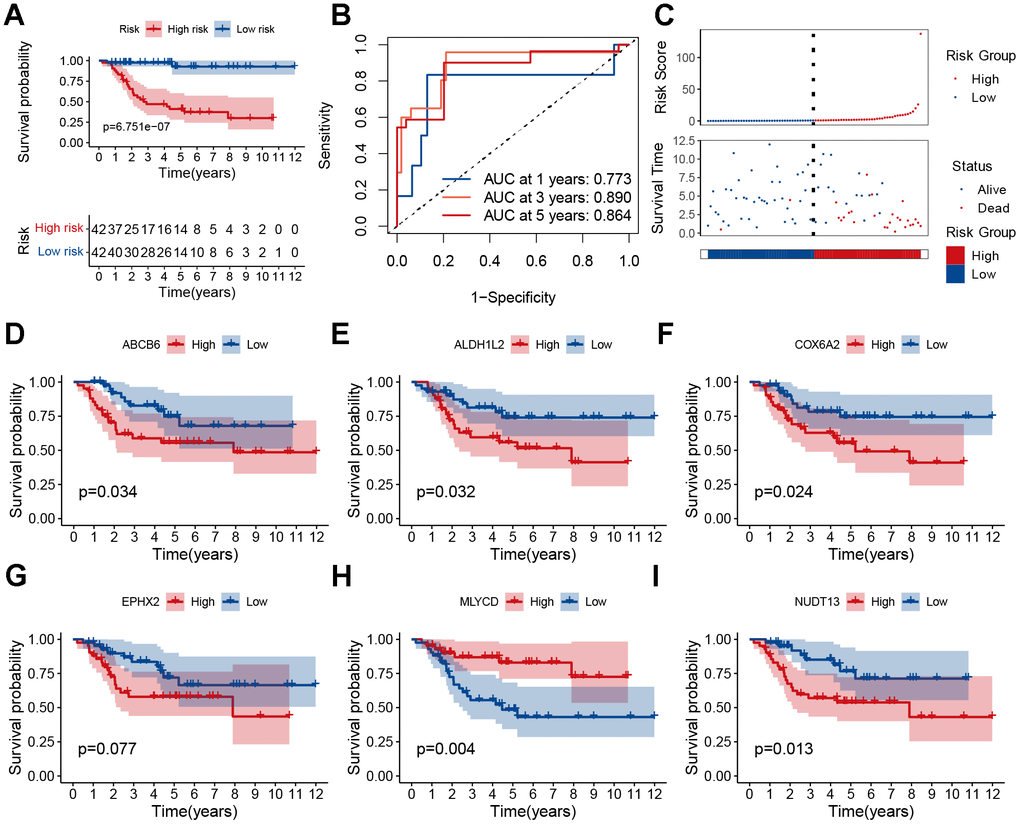
Figure 4.Prognostic analysis of the MRGs signature. (A) Kaplan–Meier survival curve analysis of patients in the high-risk group and low-risk group. (B) The AUC of time-dependent ROC curves. (C) The distributions of survival status and risk score. (D–I) Kaplan–Meier survival analysis of single genes in the TARGET cohort.