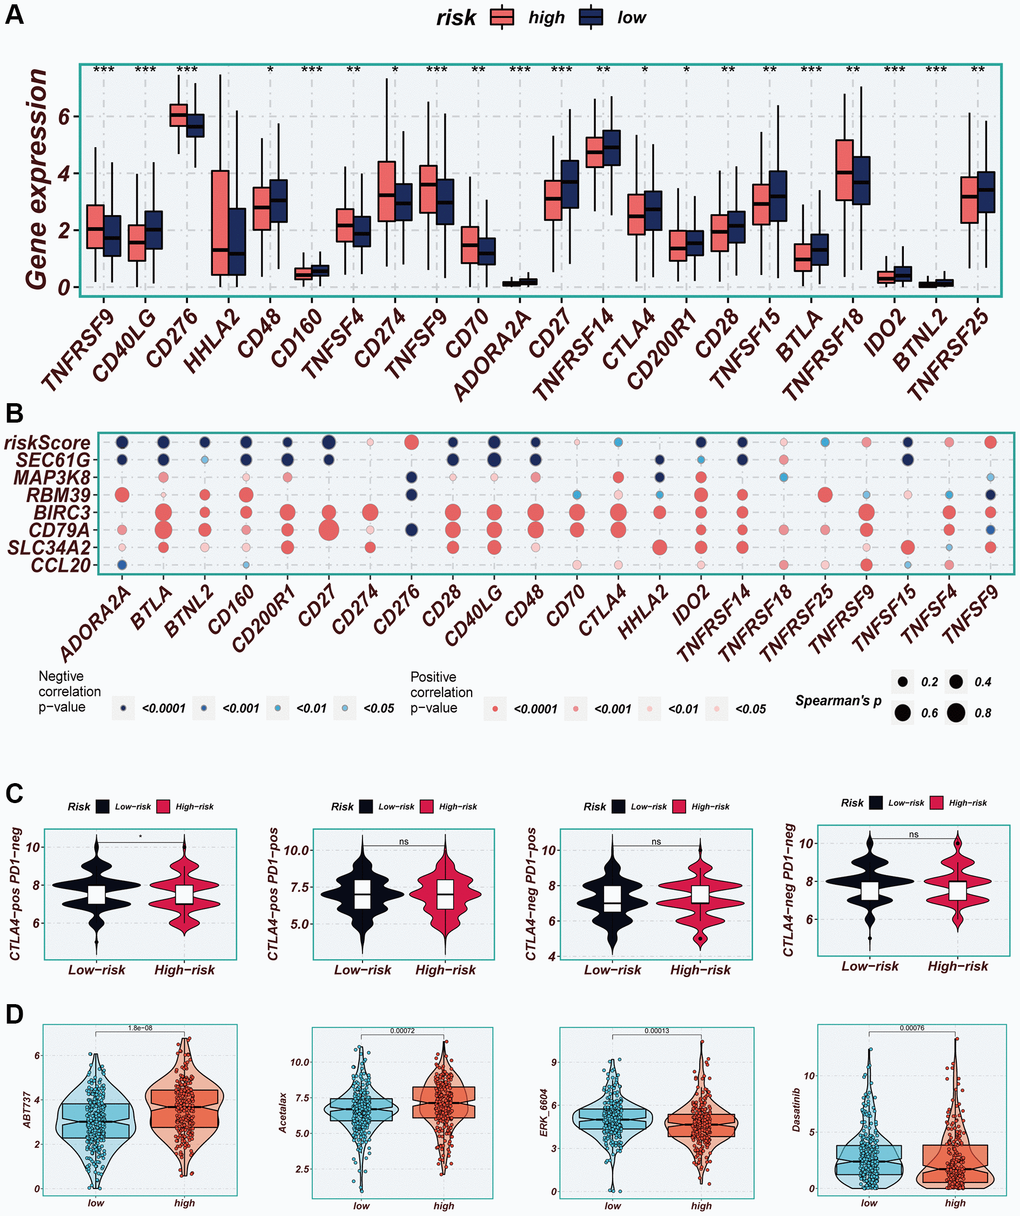
Figure 10.Immune checkpoint and immunotherapy analysis. (A) Boxplots showing the difference in immune checkpoint expression between high- and low-risk groups. (B) Correlation scatter plots showing the correlation between model genes and risk scores and immune checkpoint expression. (C) TCIA analysis showing the difference in IPS scores between different risk groups to infer the possible benefit of receiving PD-1 and CTLA-4 treatment in different risk groups. (D) Boxplots demonstrating the possible sensitivity of chemotherapeutic agents between different risk groups.