Submit an Article
Navigate
Home
Editorial Board
Editorial Policies
Current Volume
Archive
Scientific Integrity
Publication Ethics Statements
Interviews with Outstanding Authors
Newsroom
Sponsored Conferences
Podcast
Contact
Special Collections
Submit an Article
Online ISSN: 1945-4589
Research Paper
|
Volume 15, Issue 20
|
pp. 11448–11470
PPIH gene regulation system and its prognostic significance in hepatocellular carcinoma: a comprehensive analysis
Back to article
Figure 8
(8 of 10)
−
100%
+
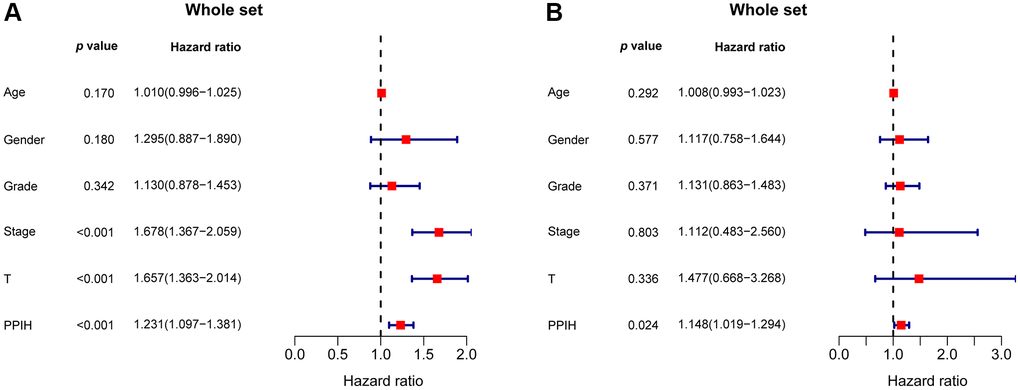
Figure 8.
The forest plot shows the univariate (
A
) and multivariate (
B
) Cox regression analysis of the relationship between PPIH expression and OS among HCC patients.