Submit an Article
Navigate
Home
Editorial Board
Editorial Policies
Current Volume
Archive
Scientific Integrity
Publication Ethics Statements
Interviews with Outstanding Authors
Newsroom
Sponsored Conferences
Podcast
Contact
Special Collections
Submit an Article
Online ISSN: 1945-4589
Research Paper
|
Volume 15, Issue 20
|
pp. 11331–11368
Exosome and lipid metabolism-related genes in pancreatic adenocarcinoma: a prognosis analysis
Back to article
Figure 10
(10 of 12)
−
100%
+
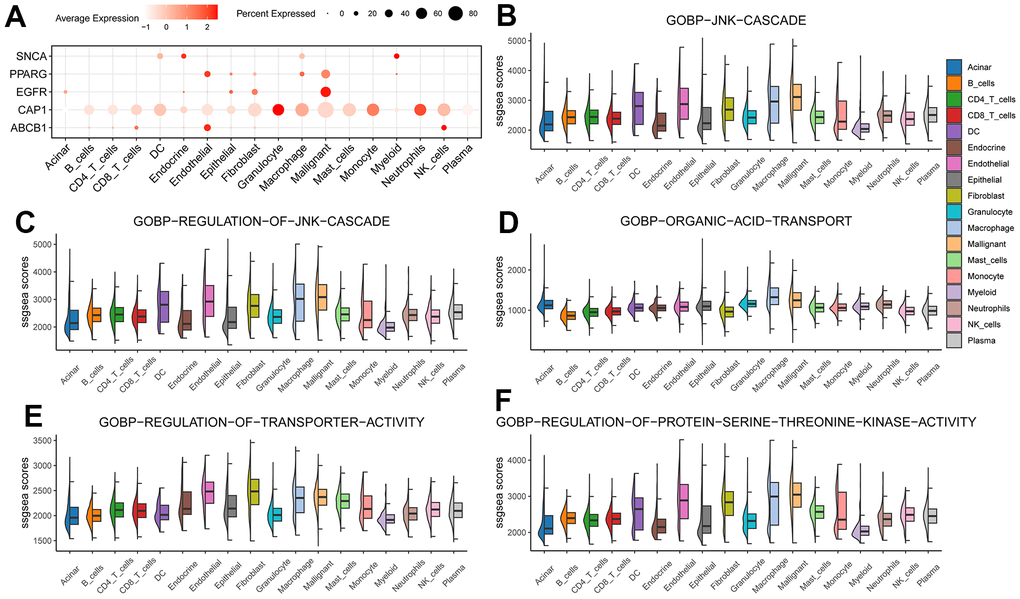
Figure 10.
Hub gene was analyzed at the single-cell level.
(
A
) Hub gene expression in individual cell types; (
B
–
F
) 5 BP enrichment scores in each cell type.