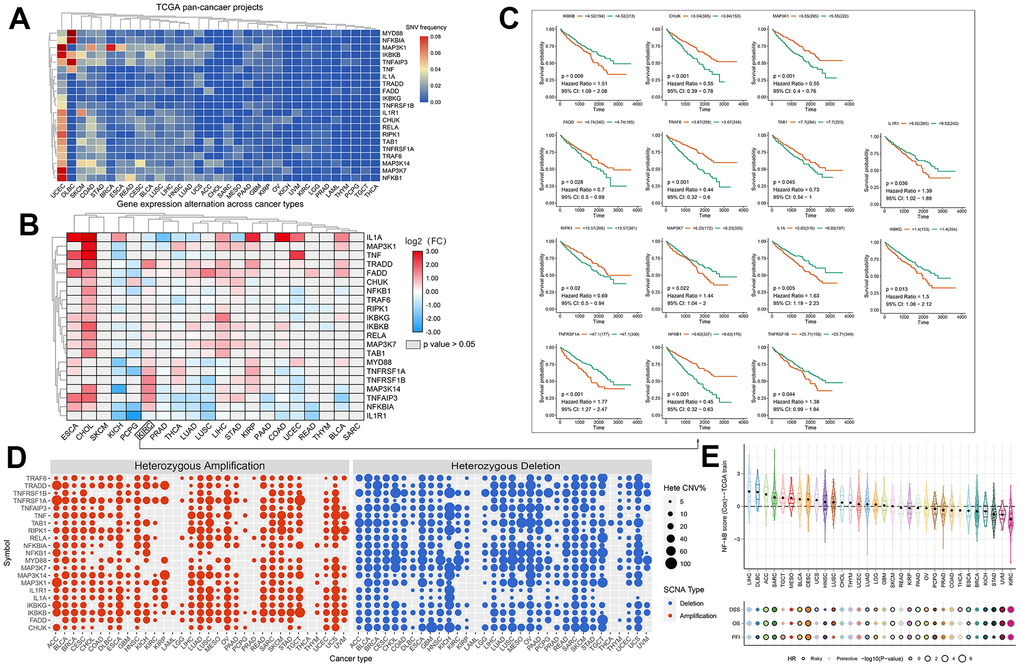
Figure 1.(A) SNV frequencies of 21 NF-κB pathway genes in 32 tumor types. Red and blue indicate high and low frequencies, respectively. (B) Expression levels of the NF-κB-related genes in 20 cancers. The color code bar shows the corresponding value of log2 (FC) on the right, with values ranging from 3.00 to -3.00 from red to blue. (C) Survival curve analysis of all statistically significant KIRC genes in TCGA samples. Red and green represent the high- and low-expression groups, respectively. (D) CNV frequencies of the 21 NF-κB pathway genes in 32 tumor types. Red and blue indicate amplification and loss of CNV, respectively. (E) Prognostic performance of the 11-gene NF-κB score in 32 types of cancers. The center color of the circle indicates the type of cancer, the color of the circle indicates “Risky/Protective”, and the size of the circle indicates statistical differences.