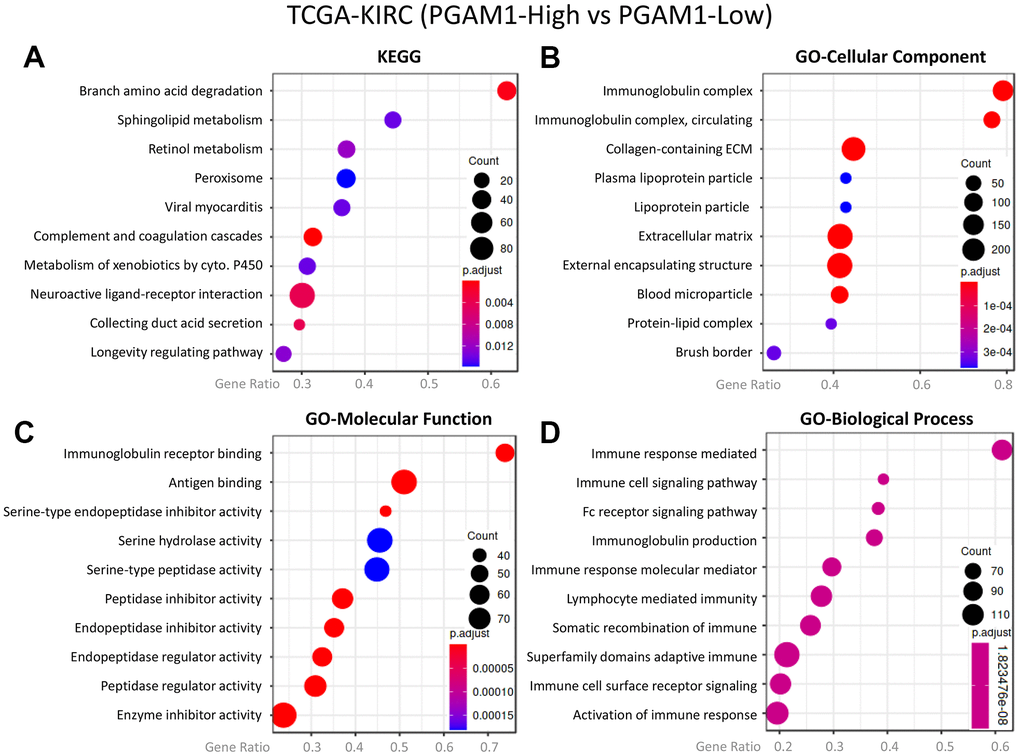
Figure 4.The co-expression genes of PGAM1 in KIRC were subjected to enrichment analysis. The target genes were analyzed using (A) Kyoto Encyclopedia of Genes and Genomes (KEGG) pathway, (B) cellular component, focusing on (C) molecular function and (D) biological process.