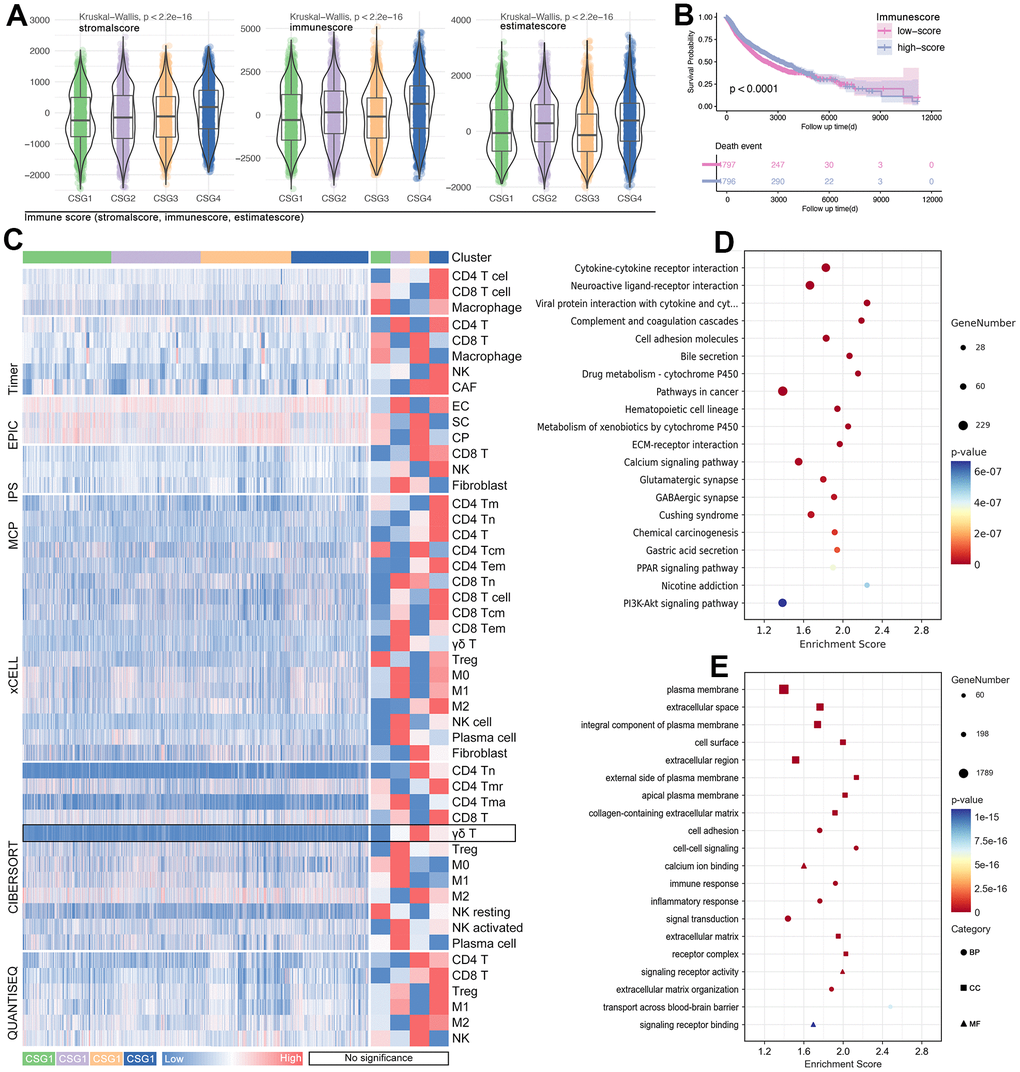
Figure 7.Tumor immunity and pathway features of CRG subgroups. (A) Stormalscore, immunescore, and estimatescore are predicted in R4.2.0. (B) K-M analysis showed the effect of immunescore on prognosis in pan-cancer. (C) Immune cell infiltration in CRG subgroups, including innate immunity and adjust immunity. (D) KEEG and (E) GO analysis showed CRG-related-genes-related molecular pathways.