Submit an Article
Navigate
Home
Editorial Board
Editorial Policies
Current Volume
Archive
Scientific Integrity
Publication Ethics Statements
Interviews with Outstanding Authors
Newsroom
Sponsored Conferences
Podcast
Contact
Special Collections
Submit an Article
Online ISSN: 1945-4589
Research Paper
|
Volume 15, Issue 19
|
pp. 10785–10810
PD-L1-related IncRNAs are associated with malignant characteristics and immune microenvironment in glioma
Back to article
Figure 2
(2 of 8)
−
100%
+
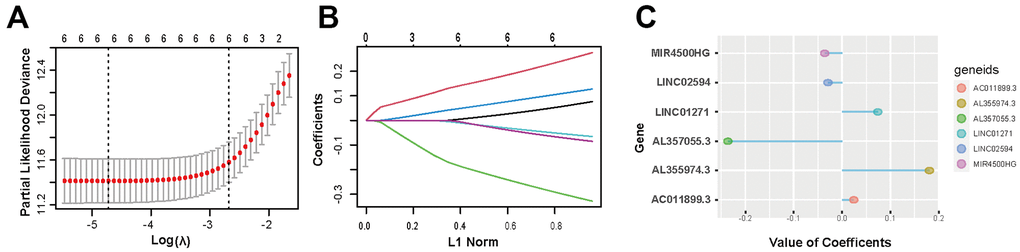
Figure 2.
Screening of 6 PD-L1-related lncRNAs.
(
A
,
B
) LASSO regression analysis is employed to determine the optimal penalty coefficient (λ). (
C
) Regression coefficients of 6 PD-L1-related lncRNAs.