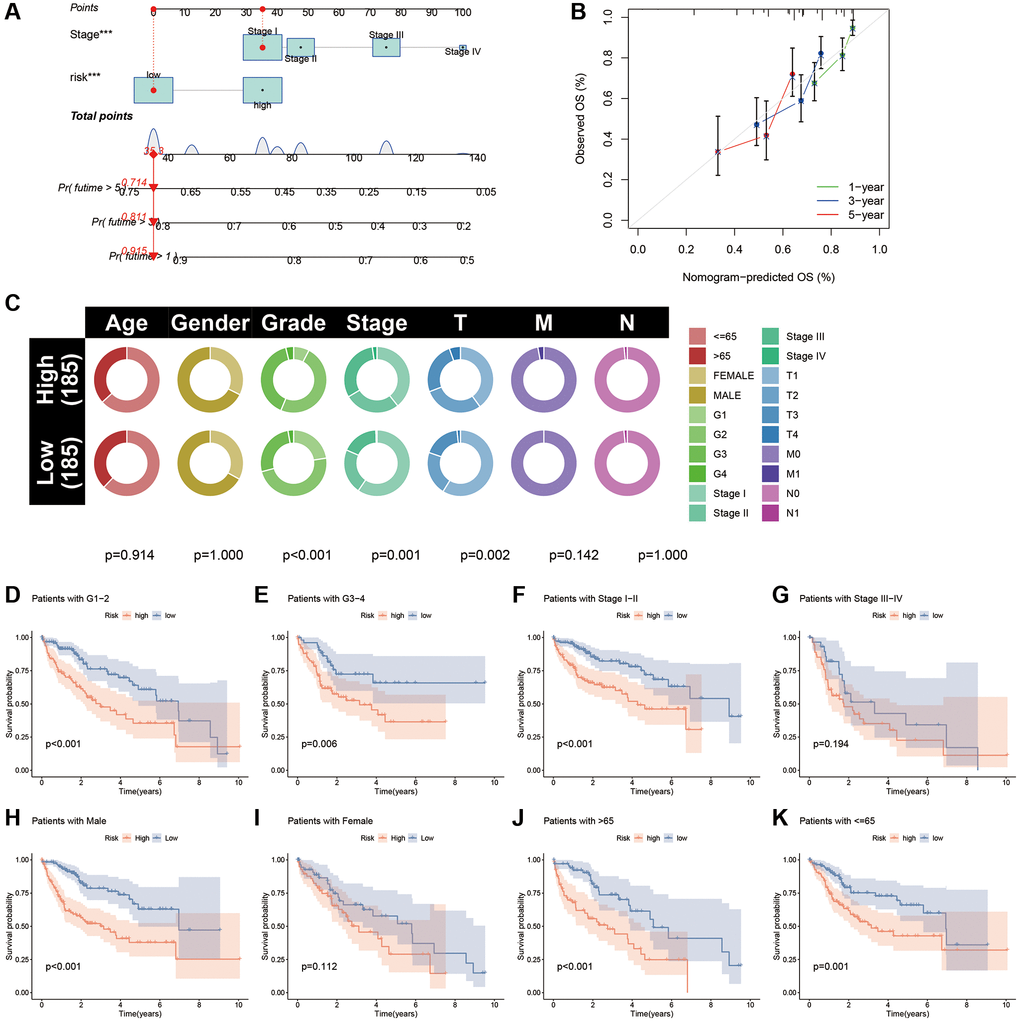
Figure 8.Nomogram and clinical subgroup analysis based on CAFRss. (A) Construction of a nomogram for HCC. (B) The calibration curves for the nomogram. (C) Circle plots show the differences in clinical parameters between the two risk subgroups. (D–K) The K-M curves show the survival differences between the high- and low-risk subgroups in the tumour grade (D, E), tumour stage (F, G), gender (H, I) and age (J, K) subgroups.