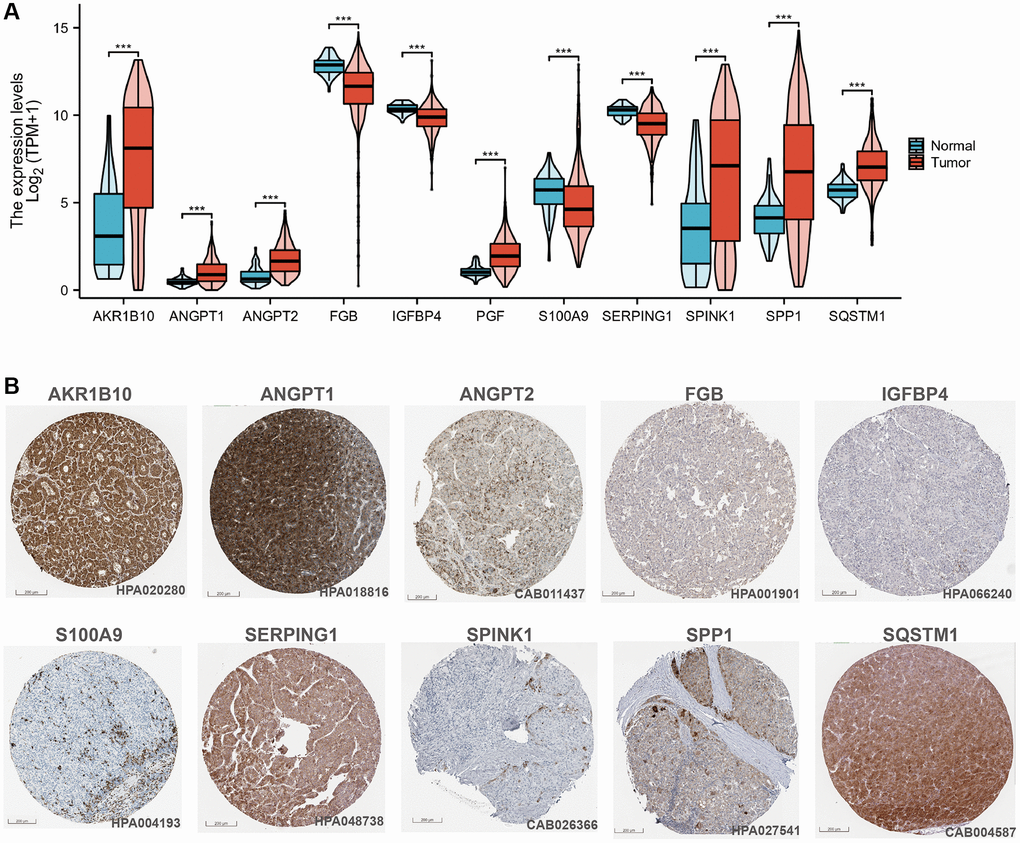
Figure 4.CAFRss-related genes in HCC. (A) Violin diagram of the expression of CAFRss genes in HCC tumour tissue and normal tissue. (B) Immunohistochemical images of proteins encoded by CAFRss-related genes in HCC tumour tissue. *P < 0.05, **P < 0.01, and ***P < 0.001.