Submit an Article
Navigate
Home
Editorial Board
Editorial Policies
Current Volume
Archive
Scientific Integrity
Publication Ethics Statements
Interviews with Outstanding Authors
Newsroom
Sponsored Conferences
Podcast
Contact
Special Collections
Submit an Article
Online ISSN: 1945-4589
Research Paper
|
Volume 15, Issue 20
|
pp. 11092–11113
Identification and validation of a cancer-associated fibroblasts-related scoring system to predict prognosis and immune landscape in hepatocellular carcinoma through integrated analysis of single-cell and bulk RNA-sequencing
Back to article
Figure 13
(13 of 13)
−
100%
+
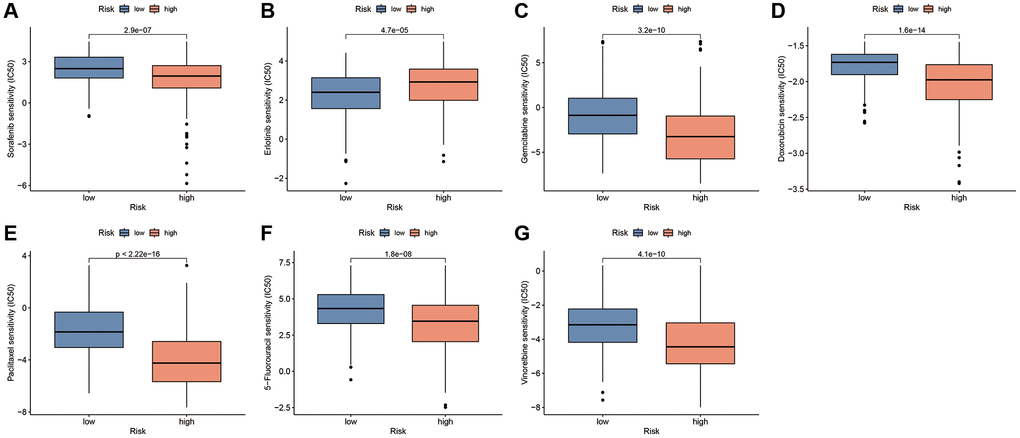
Figure 13.
Drug sensitivity analysis based on the CAFRss.
(
A
–
G
) Box plots display the drugs with different IC50 values across the risk subgroups.