Submit an Article
Navigate
Home
Editorial Board
Editorial Policies
Current Volume
Archive
Scientific Integrity
Publication Ethics Statements
Interviews with Outstanding Authors
Newsroom
Sponsored Conferences
Podcast
Contact
Special Collections
Submit an Article
Online ISSN: 1945-4589
Research Paper
|
Volume 15, Issue 20
|
pp. 10875–10896
Tissue immunoexpression of IL-6 and IL-18 in aging men with BPH and MetS and their relationship with lipid parameters and gut microbiota-derived short chain fatty acids
Back to article
Figure 5
(5 of 5)
−
100%
+
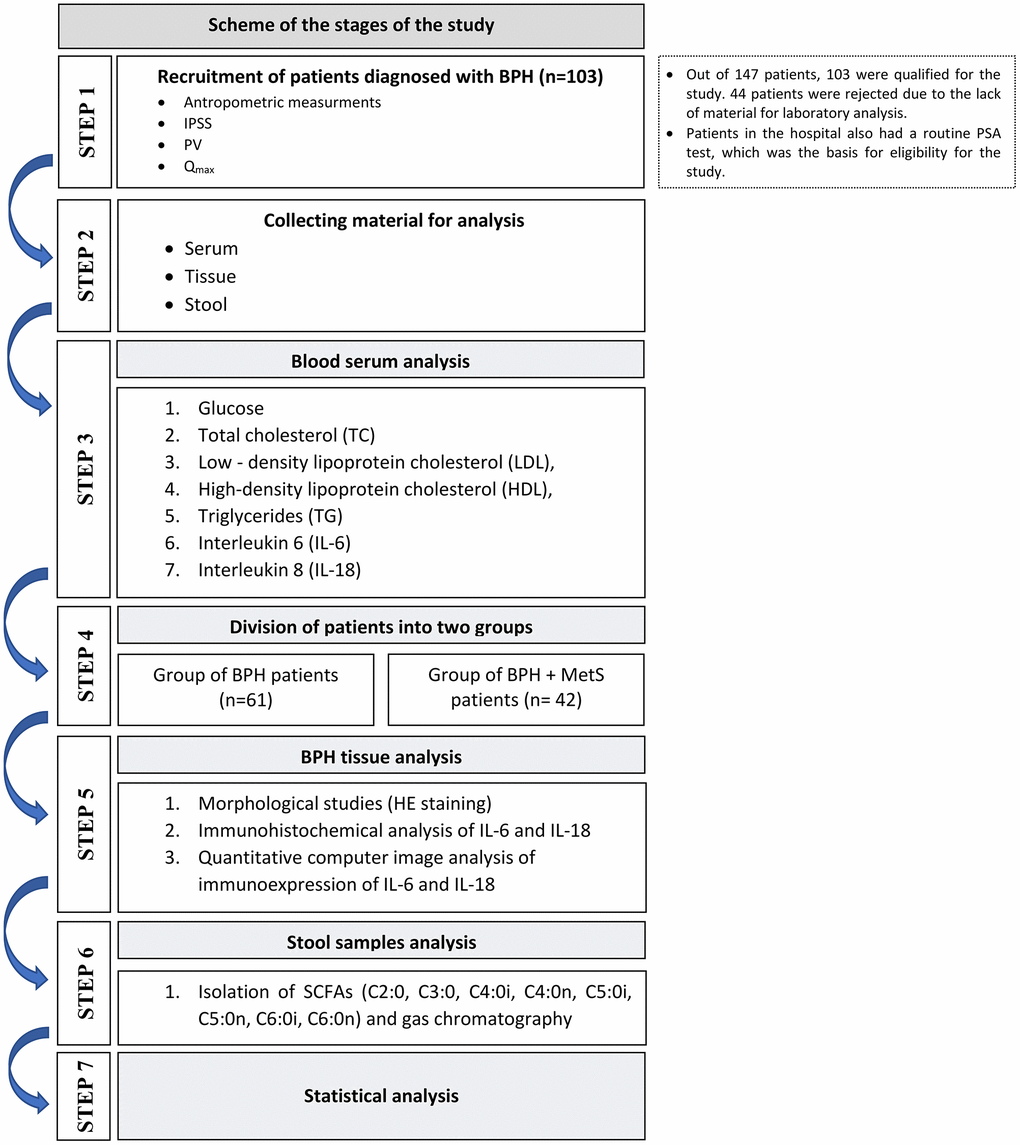
Figure 5.
Study flow chart.
Figure 5 — Tissue immunoexpression of IL-6 and IL-18 in aging men with BPH and MetS and their relationship with lipid parameters and gut microbiota-derived short chain fatty acids | Aging