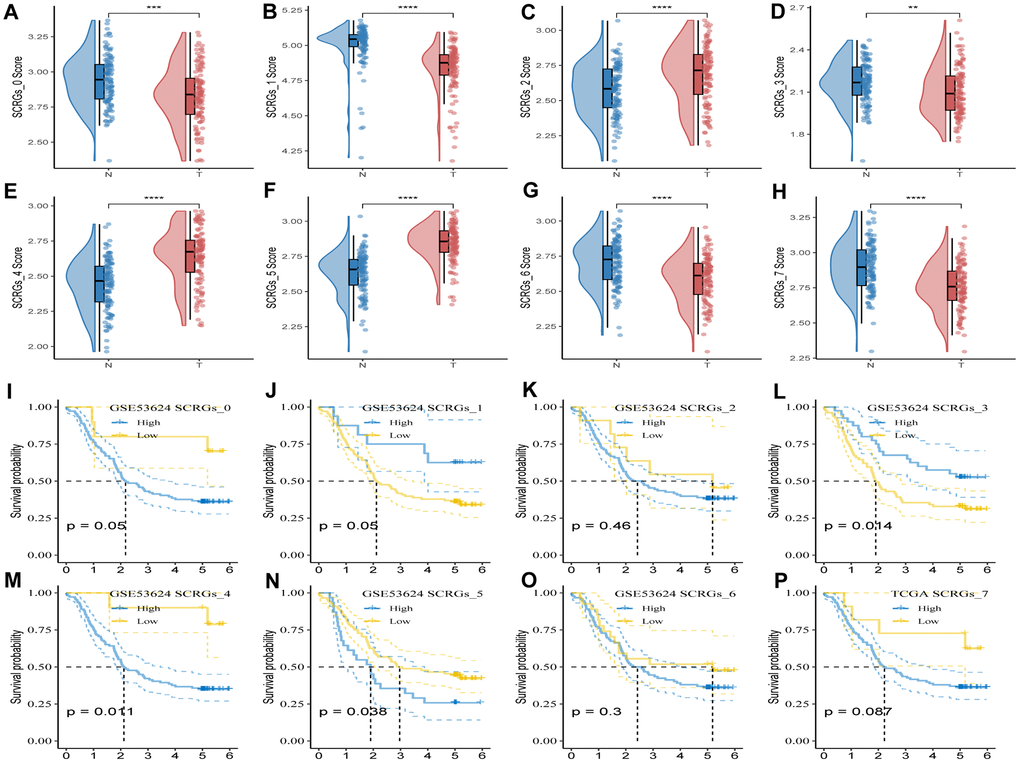
Figure 4.GSVA analysis based on SCRGs clusters. (A–H) Comparison of ssGSVA score based on each cluster between normal samples and tumor ones. (I–P) K-M curves of the high and low SCRGs score groups in the SCRGs clusters. (**P < 0.01; ***P < 0.001; ****P < 0.0001).