Submit an Article
Navigate
Home
Editorial Board
Editorial Policies
Current Volume
Archive
Scientific Integrity
Publication Ethics Statements
Interviews with Outstanding Authors
Newsroom
Sponsored Conferences
Podcast
Contact
Special Collections
Submit an Article
Online ISSN: 1945-4589
Research Paper
|
Volume 15, Issue 19
|
pp. 10501–10523
A SARS-CoV-2 related signature that explores the tumor microenvironment and predicts immunotherapy response in esophageal squamous cell cancer
Back to article
Figure 1
(1 of 11)
−
100%
+
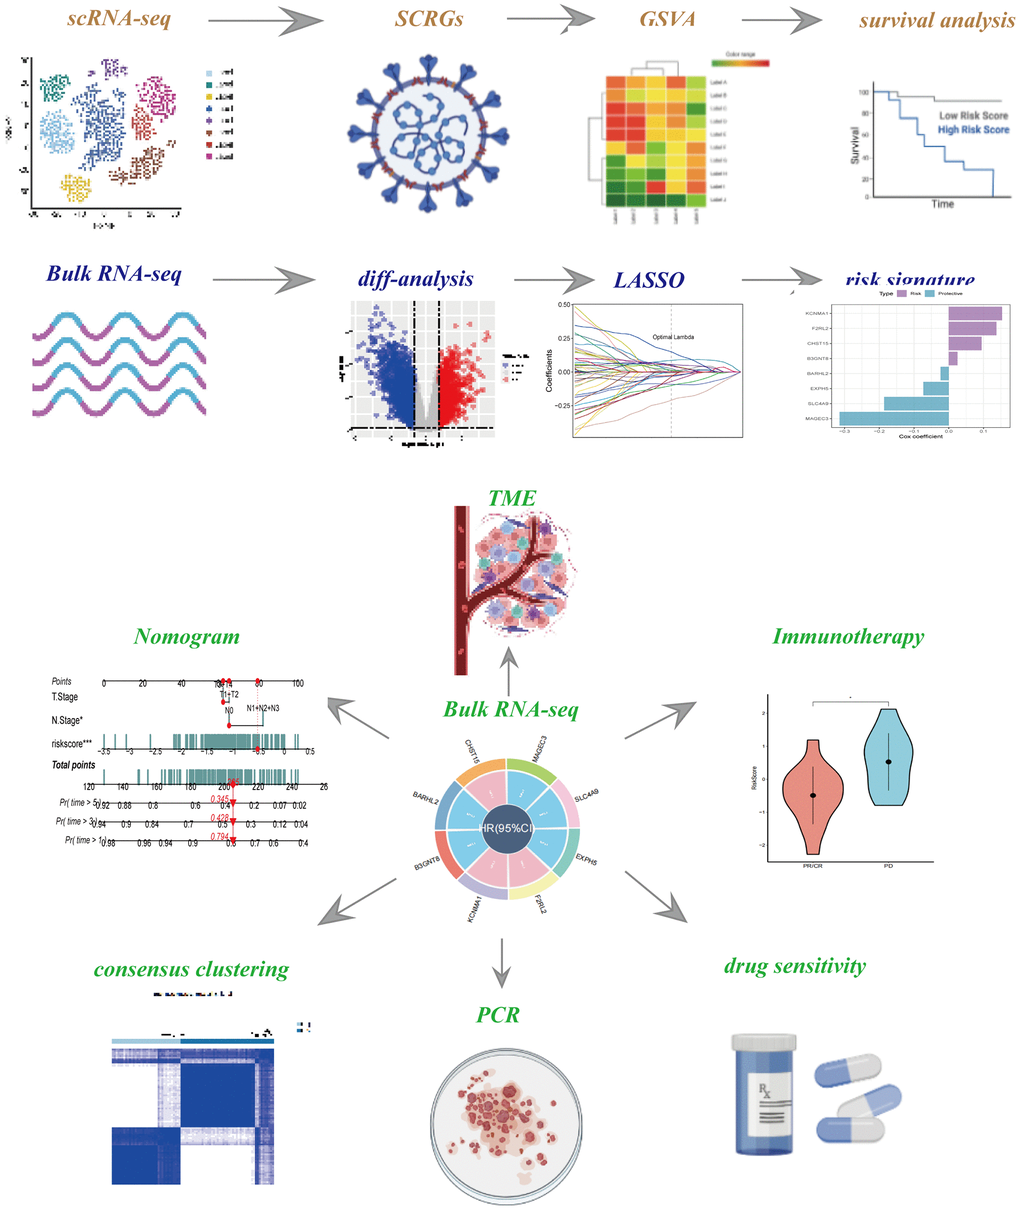
Figure 1.
The flow chart of this study.
Figure 1 — A SARS-CoV-2 related signature that explores the tumor microenvironment and predicts immunotherapy response in esophageal squamous cell cancer | Aging