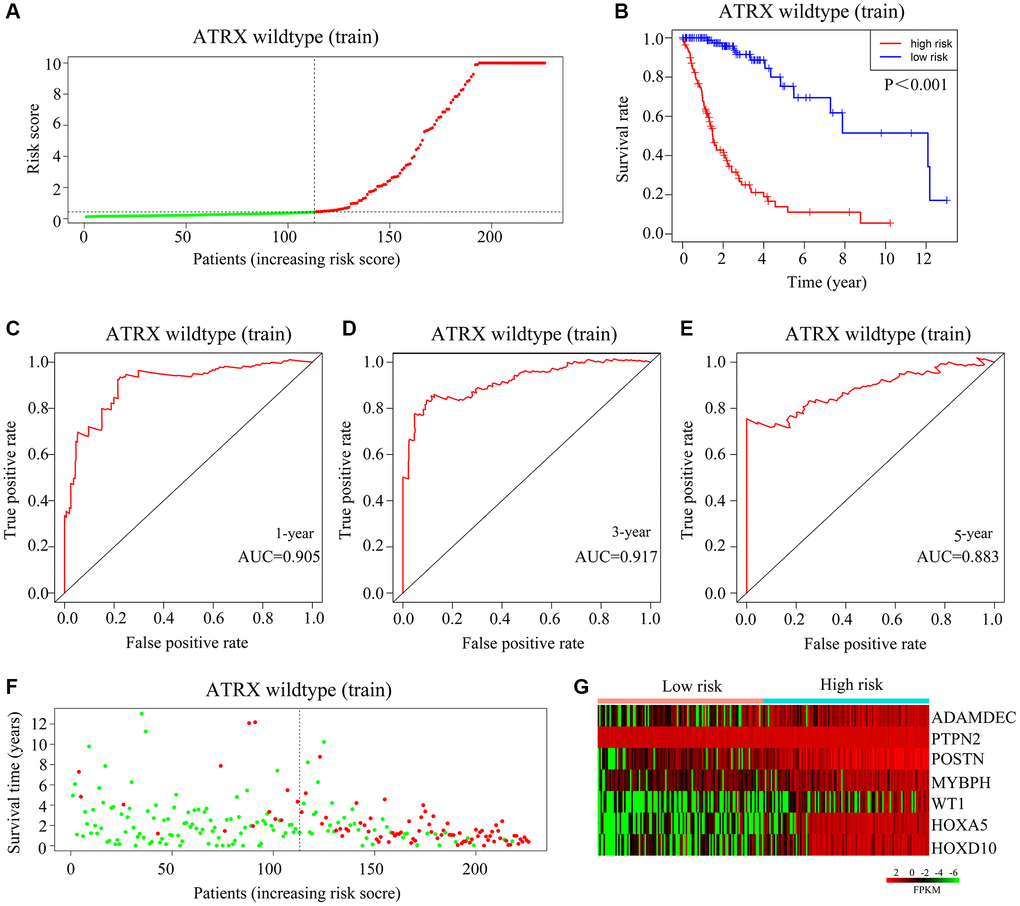
Figure 5.Validation of the applicability of the risk model in the training cohort of ATRX-wt glioma patients. (A) ATRX-wt glioma patients in the training cohort were divided into high- and low-risk-score groups based on the median risk score. (B) Survival differences between ATRX-wt glioma patients in the high- and low-risk-score groups in the training cohort. (C–E) Prognostic value of the risk model for the one-, three- and five-year survival of ATRX-wt glioma patients in the training cohort. (F) Deaths of ATRX-wt glioma patients in the high- and low-risk-score groups in the training cohort (green dots represent living cases; red dots represent dead cases). (G) Expression of HOXA5, PTPN2, WT1, HOXD10, POSTN, ADAMDEC1 and MYBPH in glioma patients in the high- and low-risk-score groups in the training cohort.