Submit an Article
Navigate
Home
Editorial Board
Editorial Policies
Current Volume
Archive
Scientific Integrity
Publication Ethics Statements
Interviews with Outstanding Authors
Newsroom
Sponsored Conferences
Podcast
Contact
Special Collections
Submit an Article
Online ISSN: 1945-4589
Research Paper
|
Volume 15, Issue 19
|
pp. 10389–10406
Novel diagnostic biomarkers of oxidative stress, immunological characterization and experimental validation in Alzheimer’s disease
Back to article
Figure 7
(7 of 11)
−
100%
+
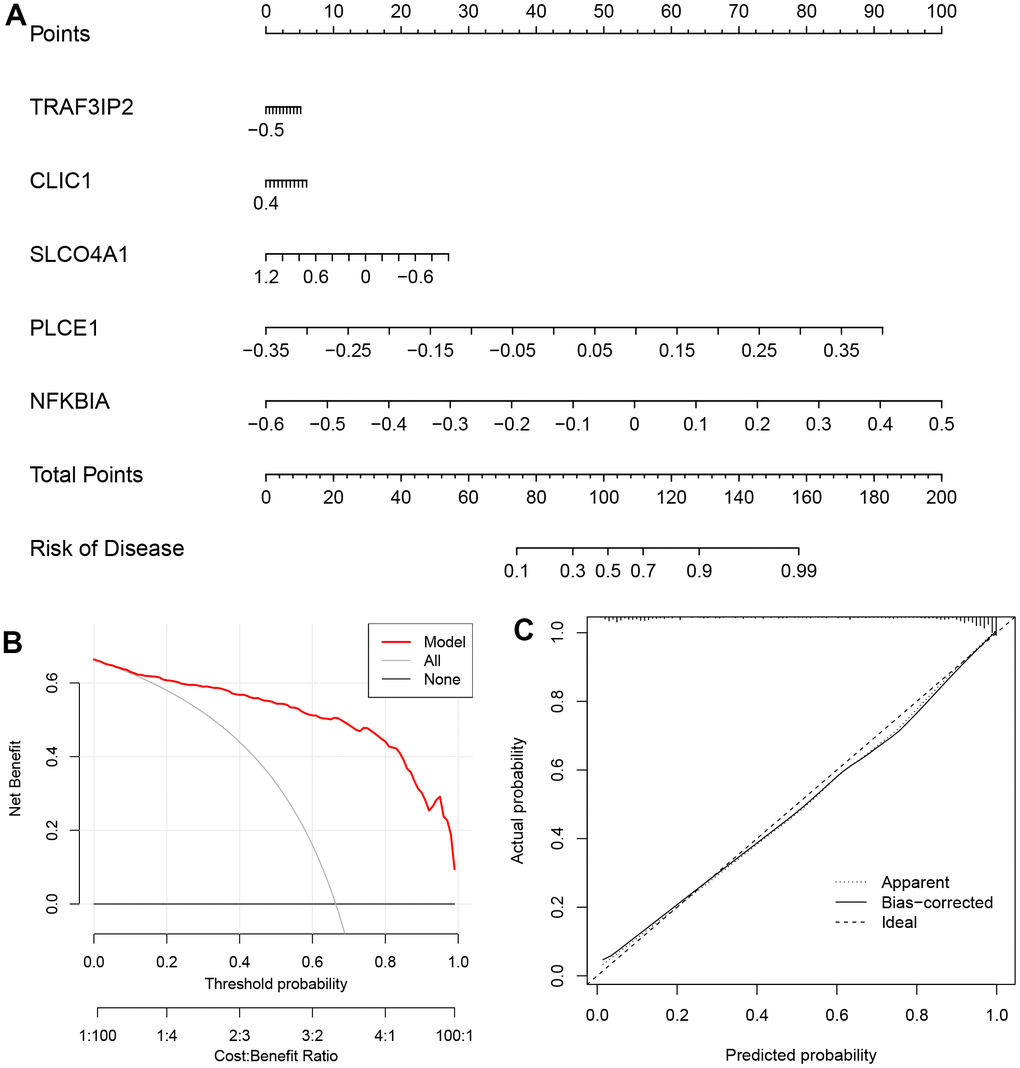
Figure 7.
The nomogram model (based on the five DEOSGs) in GSE122063.
(
A
) The nomogram. (
B
) The DCA curve. (
C
) The curve of calibration.