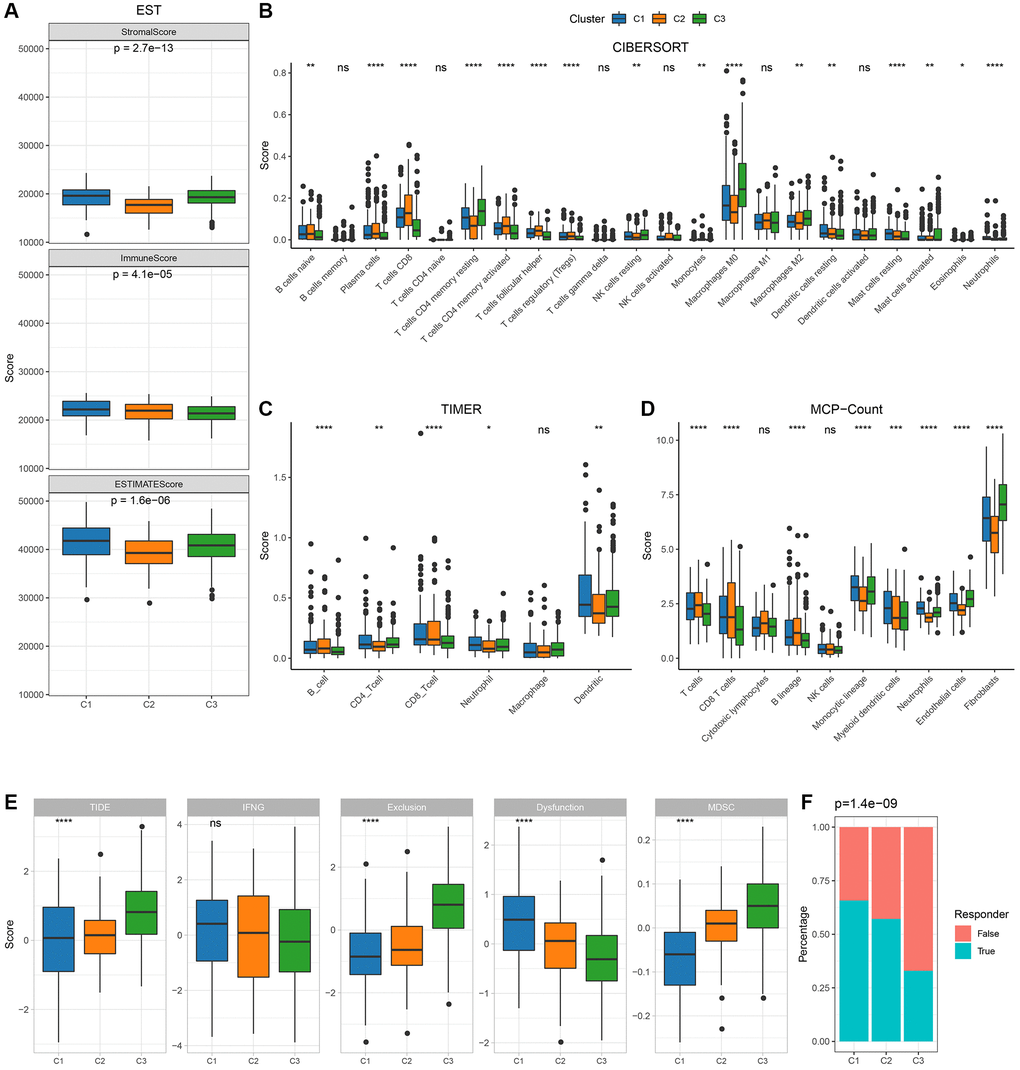
Figure 3.Immunological characteristics between molecular subtypes in TCGA cohort. (A) Differences in TCGA cohort ESTIMATE immune scores between molecular subtypes; (B) Differences in TCGA cohort TIDE scores and immune response between molecular subtypes CIBERSORT immune scores between molecular subtypes; (C) Differences in TCGA cohort TIMER calculated immune cell scores between molecular subtypes; (D) Differences in TCGA cohort MCP-Count immune scores between molecular subtypes; (E, F): TCGA cohort TIDE scores and immune response between molecular subtypes.