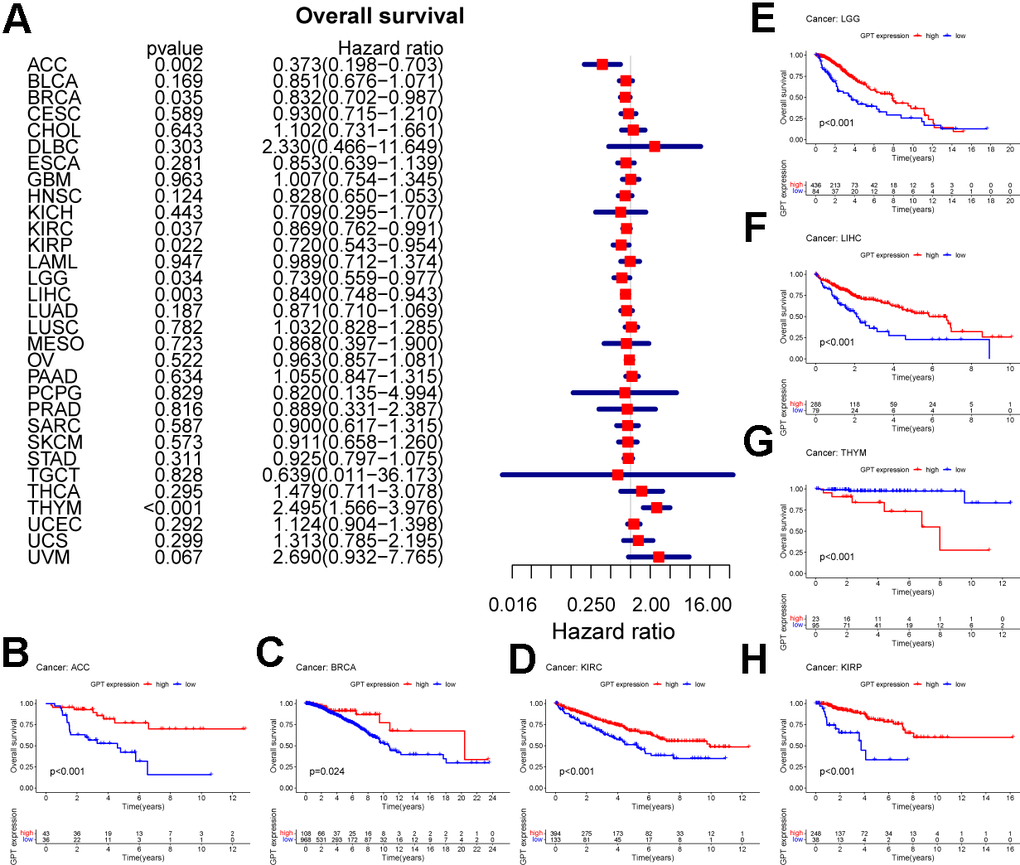
Figure 11.Prognostic value of GPT in pancancer. (A) Univariate Cox analysis to evaluate the correlation between GPT expression and OS in the patient. (B–H) Survival curves of GPT expression in 7 cancers.
Figure 11 — Systematic analysis of glutamine metabolism family genes and exploration of the biological role of GPT in colorectal cancer | Aging