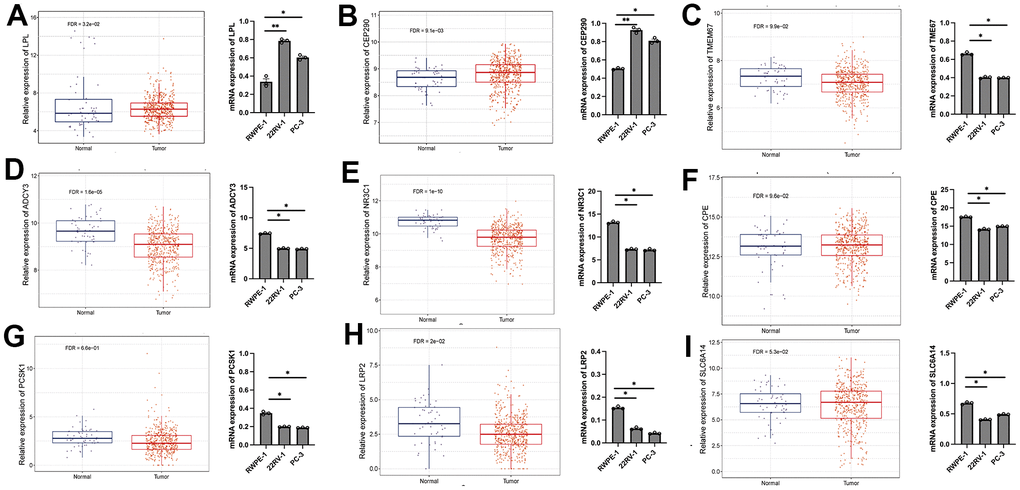
Figure 8.The expression levels of LPL (A), CEP290 (B), TMEM67 (C), ADCY3 (D), NR3C1 (E), CPE (F), PCSK1 (G), LRP2 (H) and SLC6A14 (I) in LUAD cell lines and normal prostate cell lines detected by RT-qPCR. Human prostate cell line: RWPE-1. PRAD cell line: 22RV1 and PC-3. *p < 0.05; **p < 0.01; ***p < 0.001; ****p < 0.0001. ns, not significant.