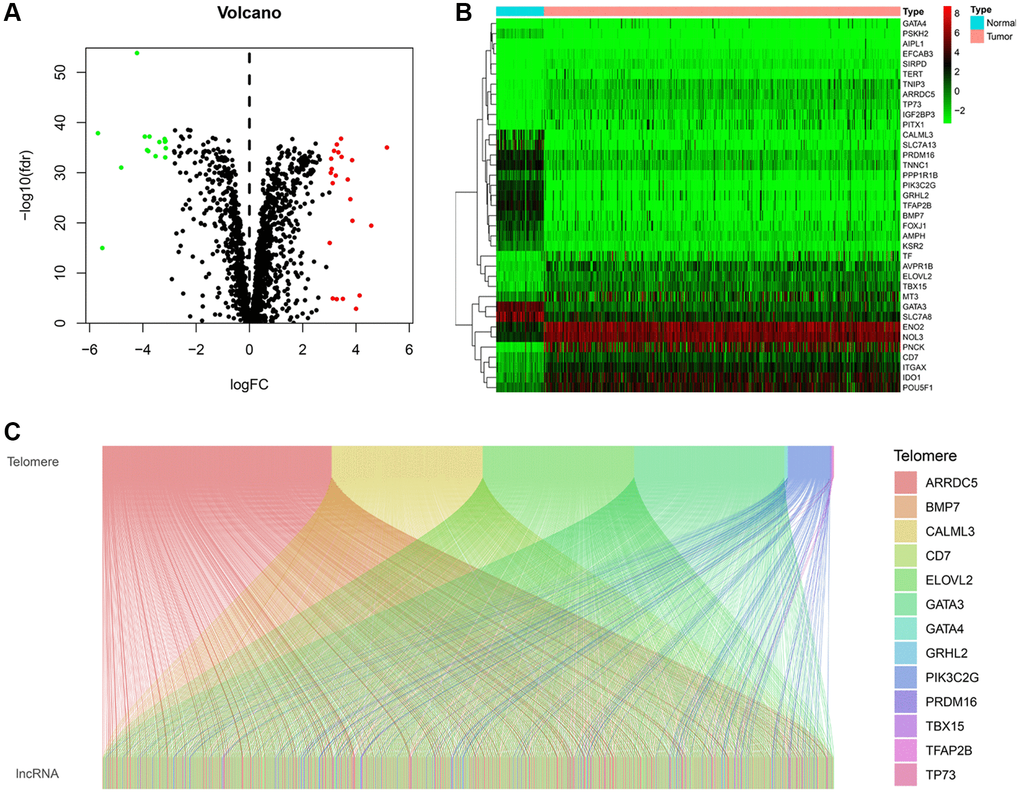
Figure 1.Identification of telomere-related lncRNAs (TRLs) in KIRC. (A) Violin plot showing the differences in the expression of telomere-related genes between normal and KIRC tissues. (B) Heatmap showing the expression profile of differentially expressed telomere-related genes. (C) Sankey graph of the co-expression networks of the TRLs and telomere-related genes.