Submit an Article
Navigate
Home
Editorial Board
Editorial Policies
Current Volume
Archive
Scientific Integrity
Publication Ethics Statements
Interviews with Outstanding Authors
Newsroom
Sponsored Conferences
Podcast
Contact
Special Collections
Submit an Article
Online ISSN: 1945-4589
Research Paper
|
Volume 15, Issue 20
|
pp. 10996–11011
BTN2A2, a new biomarker and therapeutic target for glioma
Back to article
Figure 5
(5 of 9)
−
100%
+
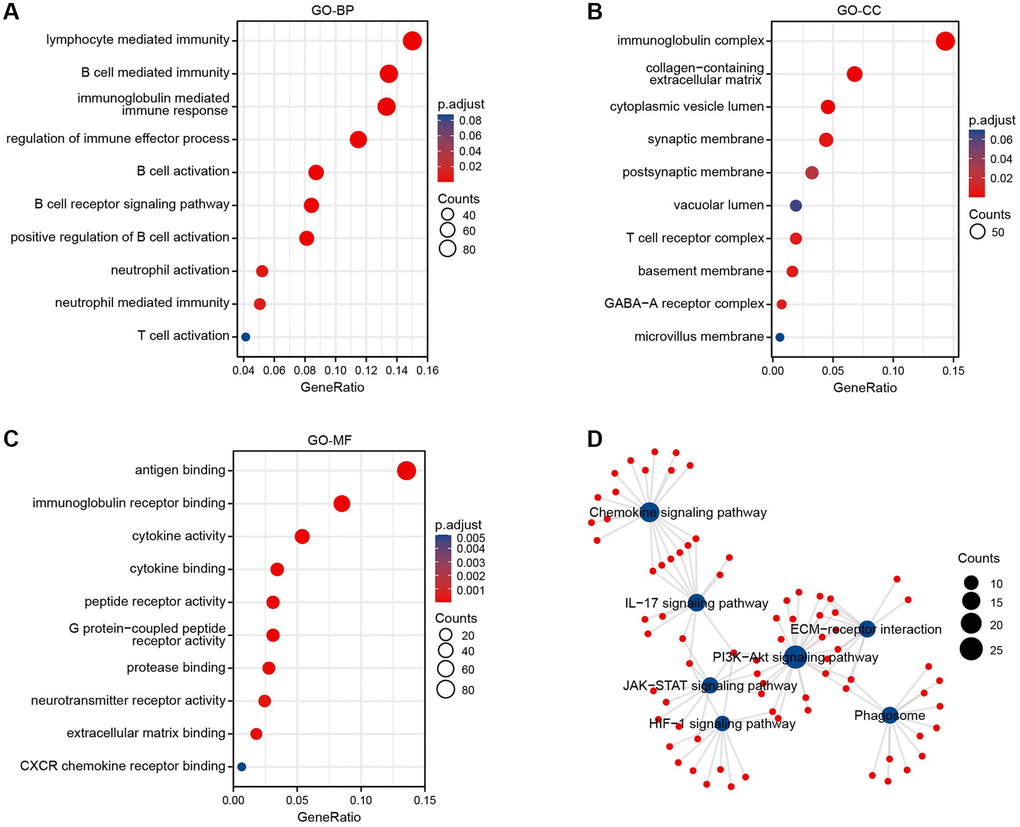
Figure 5.
Enrichment analysis of BTN2A2 in glioma.
(
A
–
C
) The GO enrichment analysis was performed on BTN2A2 using TCGA. (
D
) The KEGG pathway analysis of BTN2A2 using the TCGA database.