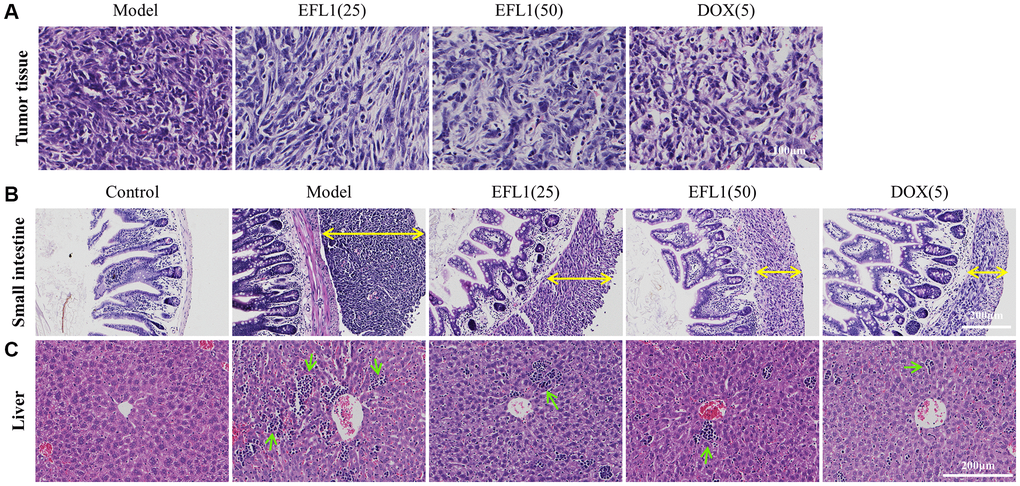
Figure 2.Representative histology sections stained with H&E. (A) Representative pictures of liver tumor sections. Scale bars: 100 μm. (B) Representative pictures of small intestine sections. Yellow double arrows denote tumor size. Scale bars: 200 μm. (C) Representative pictures of liver sections. Green arrows denote inflammatory cells. Scale bars: 200 μm.