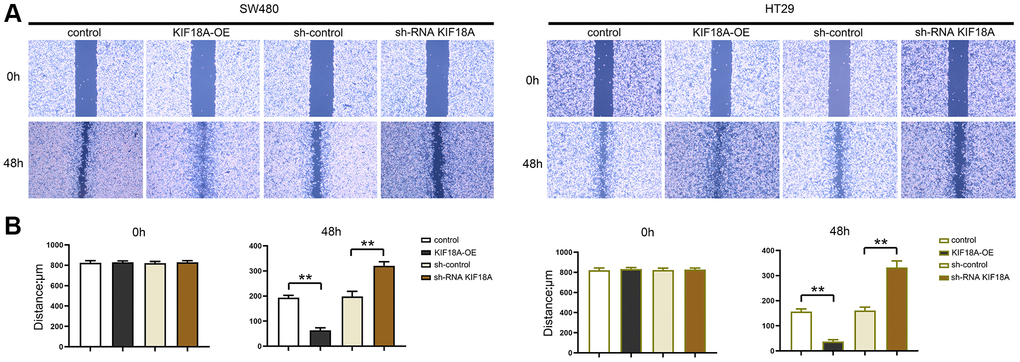
Figure 4.Effect of KIF18A on CRC cells migration ability. (A) Scratch wound diagrams at 0 h and 48 h in sh-control group, sh-RNA KIF18A group, control group, KIF18A-OE group. (B) Statistics of scratch-wound space at 0 h and 48 h in sh-control group, sh-RNA KIF18A group, control group, KIF18A-OE group (**p < 0.01; N = 3).