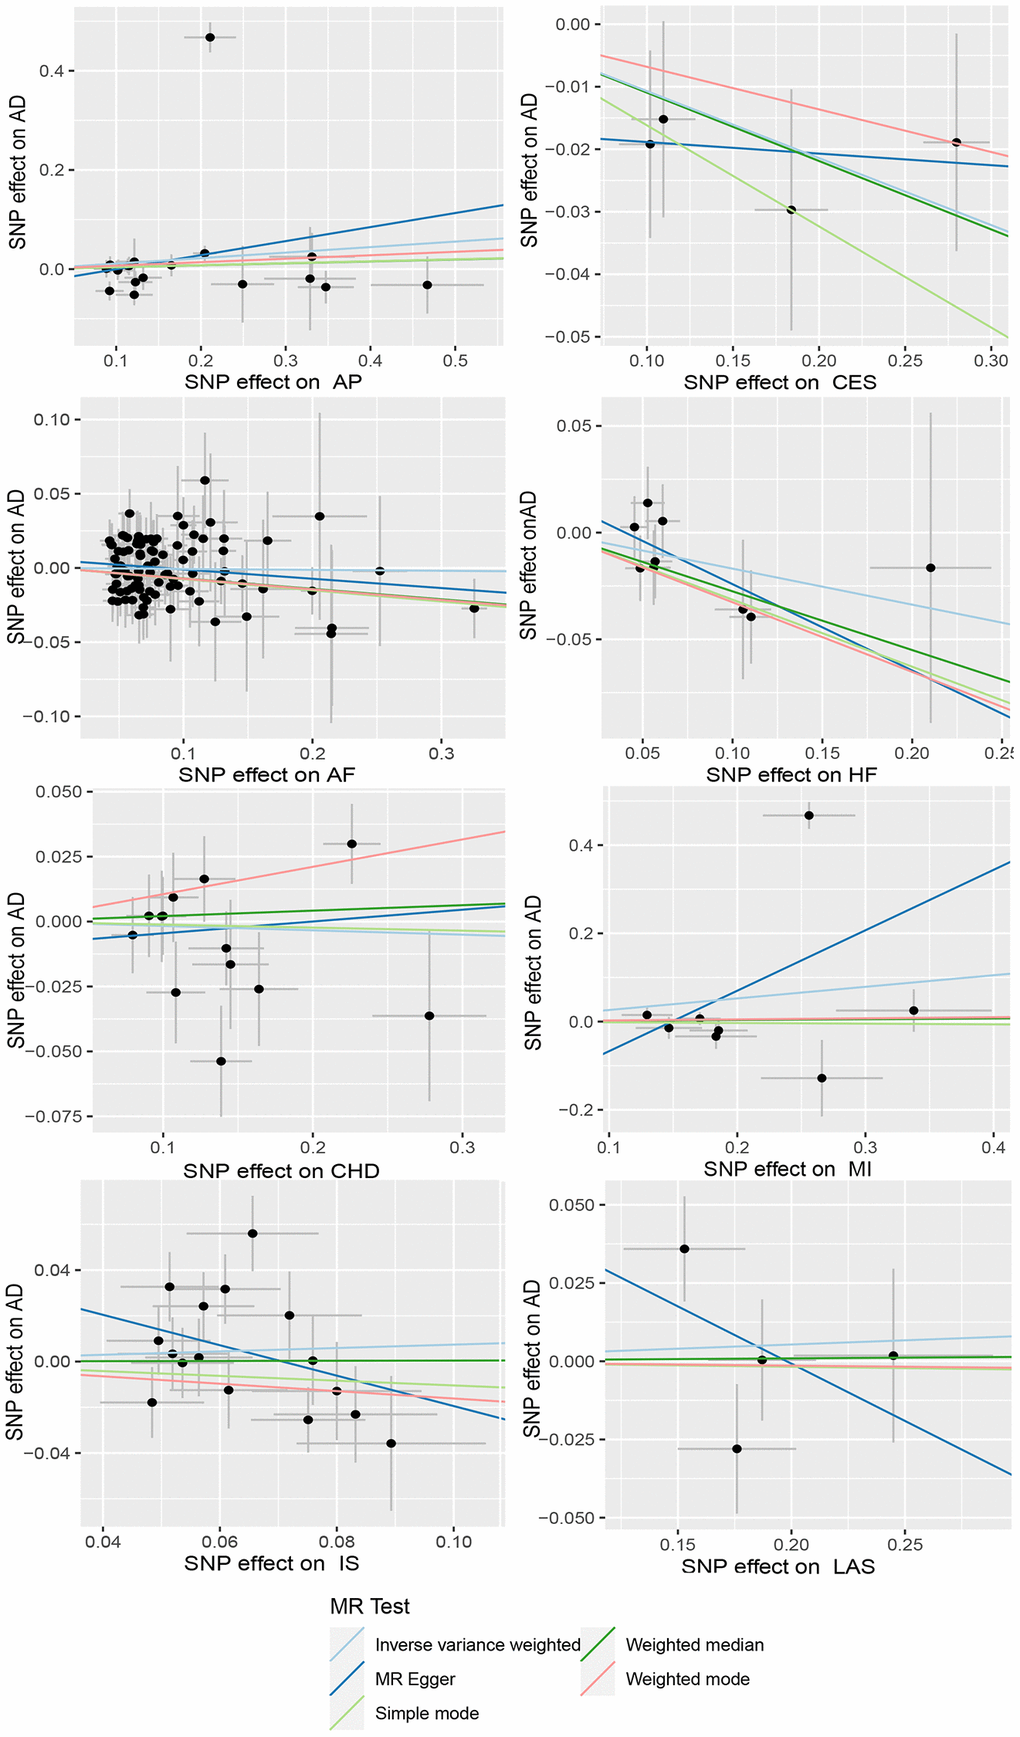
Figure 5.Scatter plots of CVD and AD. The horizontal coordinate represents the effect of SNP on exposure when CVD is an exposure; the ordinate represents the effect of SNPS on outcomes when AD is the outcome. Abbreviations: AD: Alzheimer’s disease; CVD: cardiovascular disease; AP: Angina pectoris; CES: Cardioembolic stroke; AF: Atrial fibrillation; HF: Heart failure; CHD: Coronary heart disease; MI: Myocardial infarction; IS: Ischemic stroke; LAS: Large-artery atherosclerotic stroke.