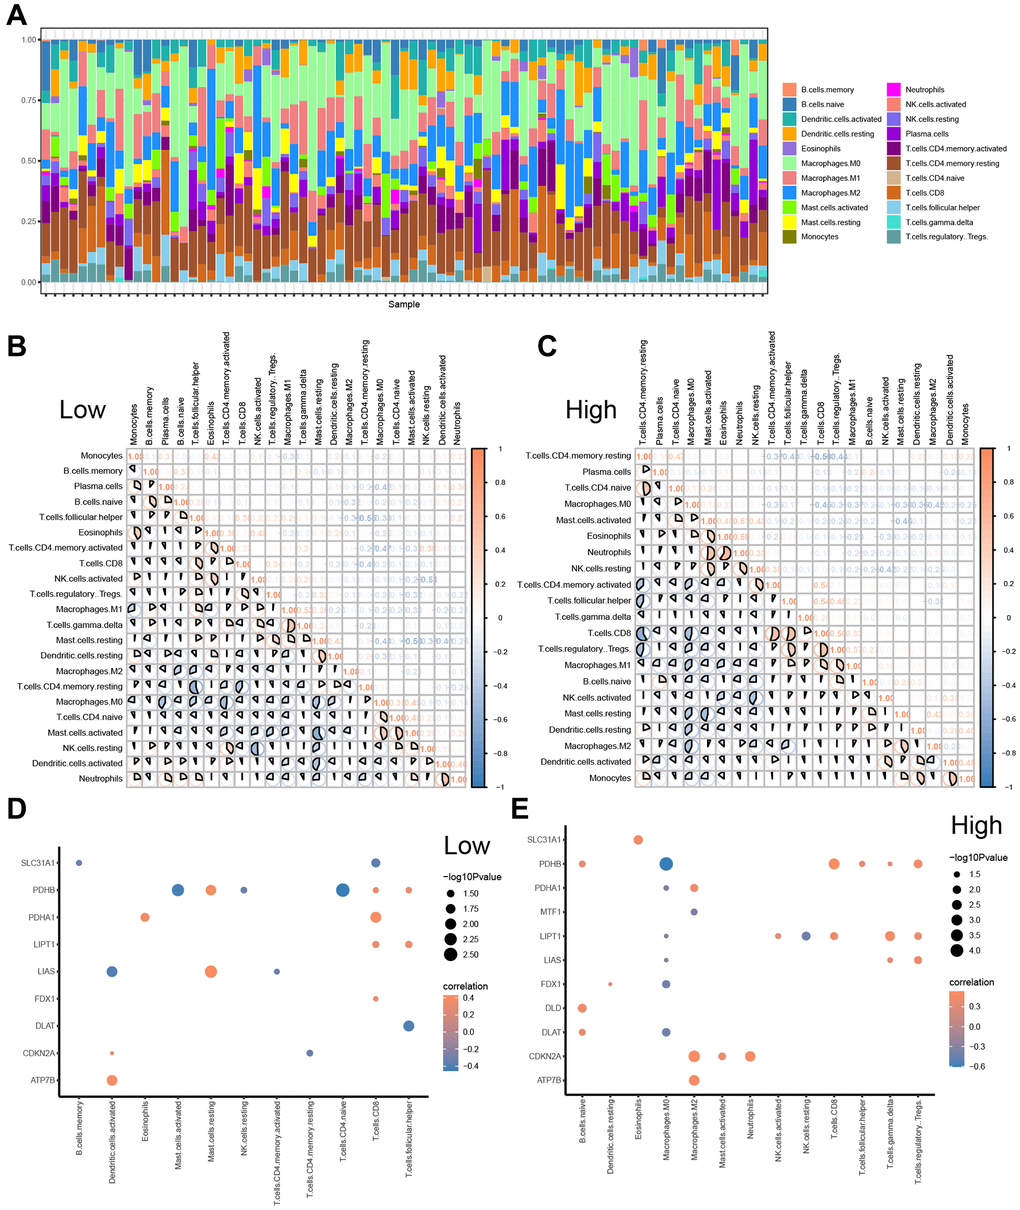
Figure 9.CIBERSORTX for immune cell infiltration analysis between the low-and high-risk groups. (A) Boxplot present the infiltration abundances analysis of immune cells from TCGA-ESCC cohort by CIBERSORT algorithm. (B, C) Correlation analysis among infiltration abundance of immune cells in low-risk group (B) and high-risk group (C) from TCGA-ESCC cohort. (D, E) Correlation analysis between infiltration abundance of immune cells and expression levels of CRGs in low-risk group (D) and high-risk group (E).