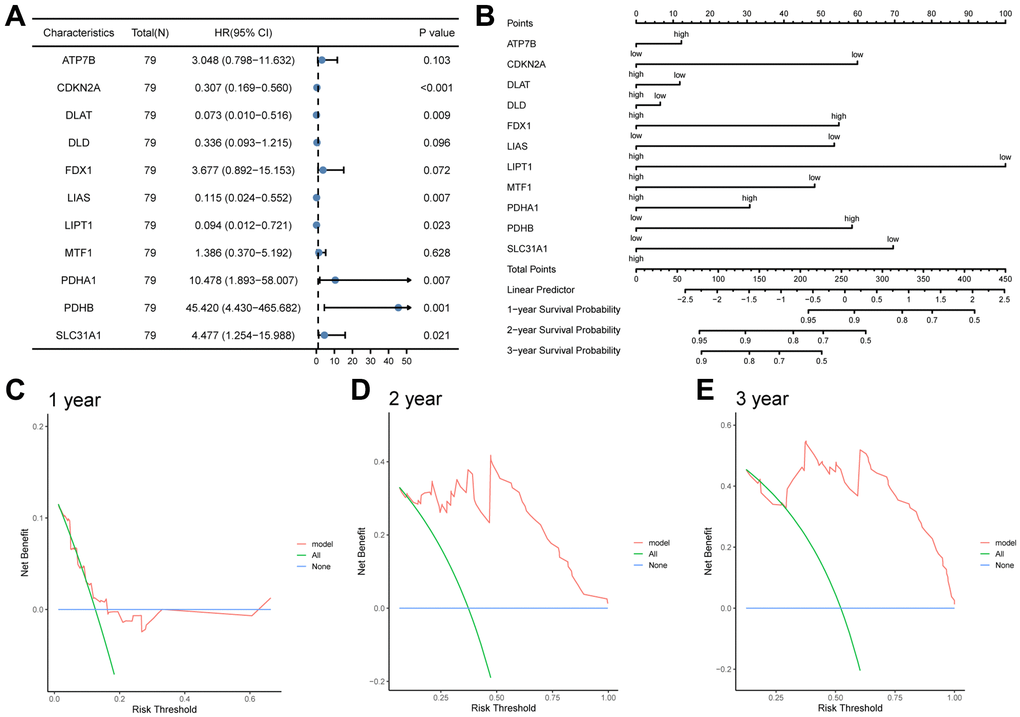
Figure 10.The prognostic value of the CRGs prognosis model. (A, B) Univariate and multivariate cox regression analysis Forest plots (A), nomogram (B). (C, D) Decision curve analyses (DCA) of LASSO-Cox regression prognosis model for predicting 1-year (C), 2-year (D), and 3-year (E).