Submit an Article
Navigate
Home
Editorial Board
Editorial Policies
Current Volume
Archive
Scientific Integrity
Publication Ethics Statements
Interviews with Outstanding Authors
Newsroom
Sponsored Conferences
Podcast
Contact
Special Collections
Submit an Article
Online ISSN: 1945-4589
Research Paper
|
Volume 15, Issue 17
|
pp. 8851–8872
Integrative analysis identifies AKAP8L as an immunological and prognostic biomarker of pan-cancer
Back to article
Figure 3
(3 of 14)
−
100%
+
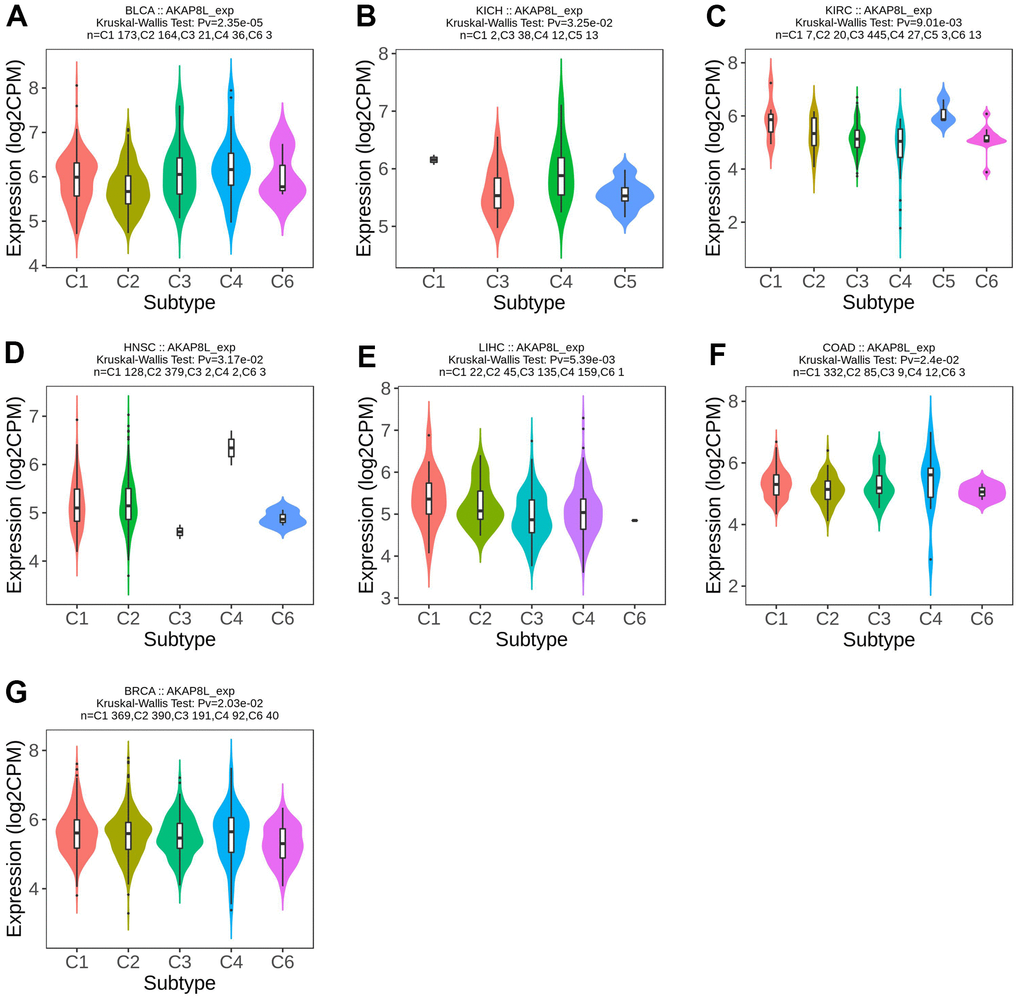
Figure 3.
Correlations between AKAP8L expression and immune subtypes across TCGA tumors.
(
A
) BLCA; (
B
) KICH; (
C
) KIRC; (
D
) HNSC; (
E
) LICH; (
F
) COAD; (
G
) BRCA.