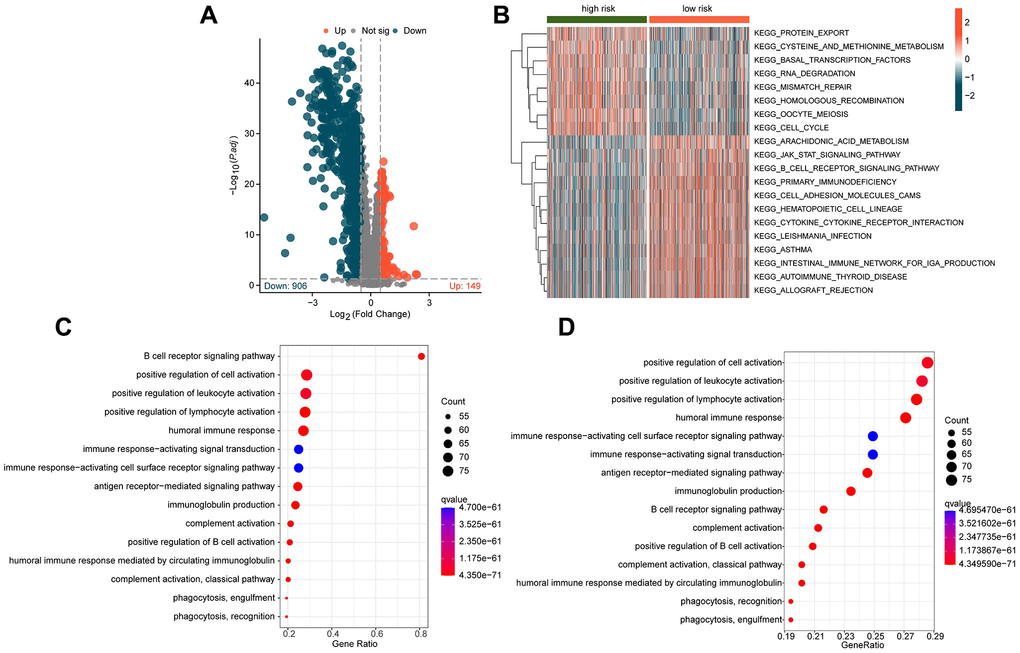
Figure 5.Exploration of potential mechanisms in different ICDRLs risk subgroups. (A) Differential gene expression analysis of risk subgroups. (B) GSVA analysis of different ICDRLs risk subgroups. (C, D) GO and KEGG enrichment analysis of differentially expressed genes.