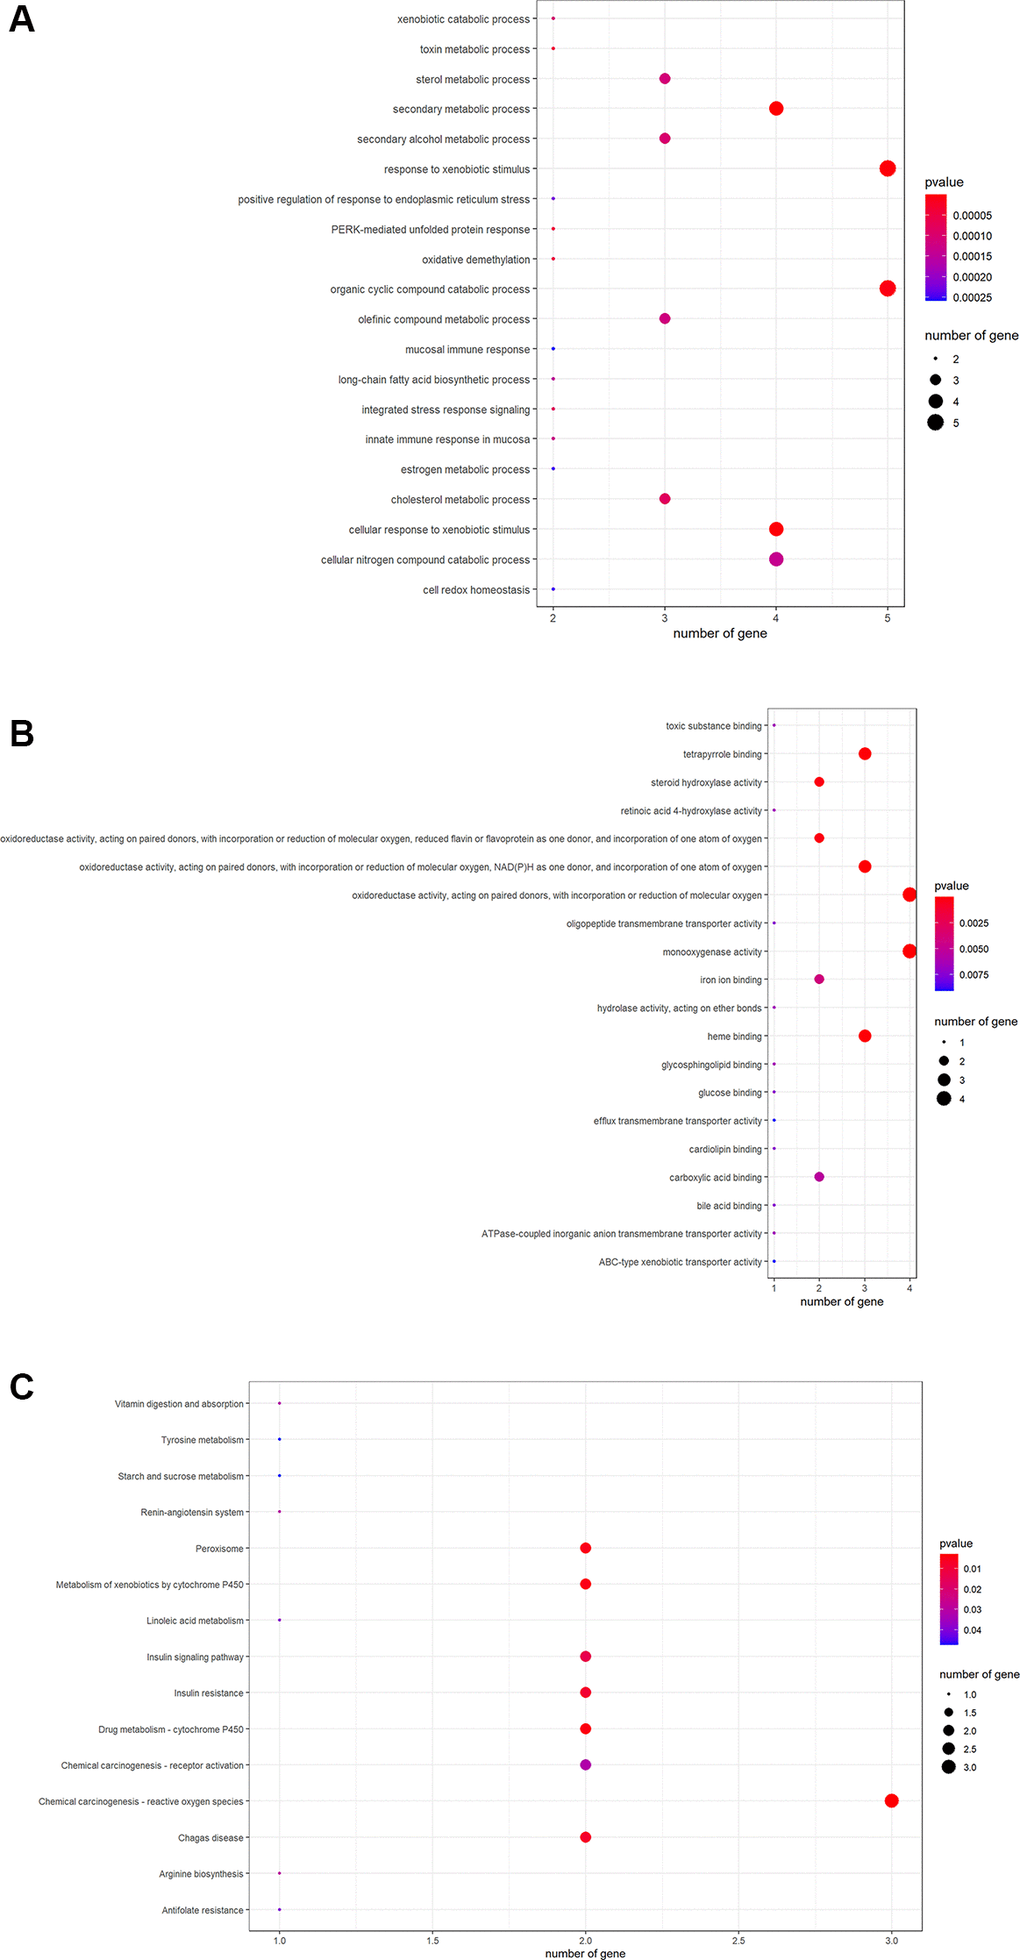
Figure 2.The data from GO functional analysis were sorted in ascending sequence of p-value, and the top annotations were highlighted accordingly in bubble diagrams, as showed in biological process annotations (A), cellular component annotations (B), molecular function annotations (C).