Submit an Article
Navigate
Home
Editorial Board
Editorial Policies
Current Volume
Archive
Scientific Integrity
Publication Ethics Statements
Interviews with Outstanding Authors
Newsroom
Sponsored Conferences
Podcast
Contact
Special Collections
Submit an Article
Online ISSN: 1945-4589
Research Paper
|
Volume 15, Issue 17
|
pp. 8770–8781
Prognostic value of lactate dehydrogenase in patients with uveal melanoma treated with immune checkpoint inhibition
Back to article
Figure 5
(5 of 5)
−
100%
+
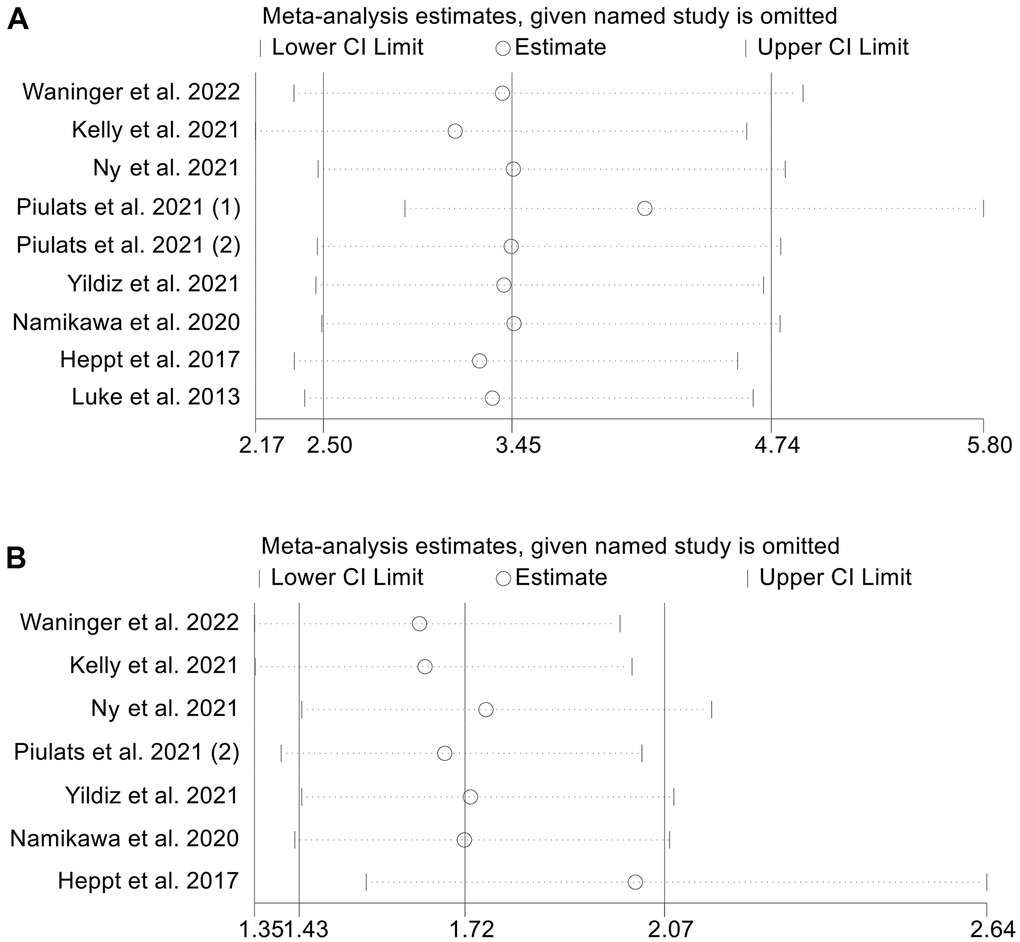
Figure 5.
Sensitivity analysis of the association between baseline LDH levels and overall survival (
A
) and progression-free survival (
B
). CL, confidence interval.