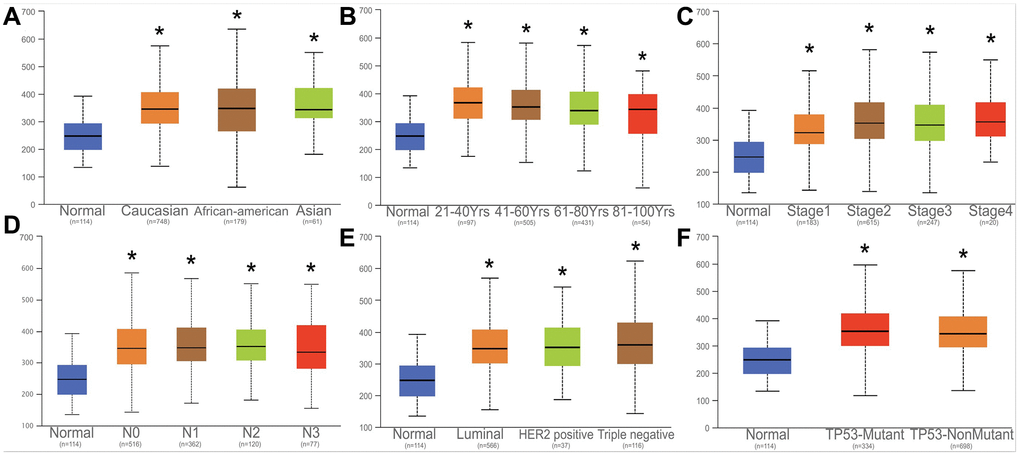
Figure 6.Correlation analysis with HNRNPA2B1 and clinical parameters. Correlation analysed with HNRNPA2B1 expression and different counties (A), age (B), tumor stage (C), N stage (D), Breast cancer subtype (E), TP53-mutation (F).
Figure 6 — HNRNPA2B1 is a potential biomarker of breast cancer related to prognosis and immune infiltration | Aging