Submit an Article
Navigate
Home
Editorial Board
Editorial Policies
Current Volume
Archive
Scientific Integrity
Publication Ethics Statements
Interviews with Outstanding Authors
Newsroom
Sponsored Conferences
Podcast
Contact
Special Collections
Submit an Article
Online ISSN: 1945-4589
Research Paper
|
Volume 15, Issue 17
|
pp. 8712–8728
HNRNPA2B1 is a potential biomarker of breast cancer related to prognosis and immune infiltration
Back to article
Figure 5
(5 of 9)
−
100%
+
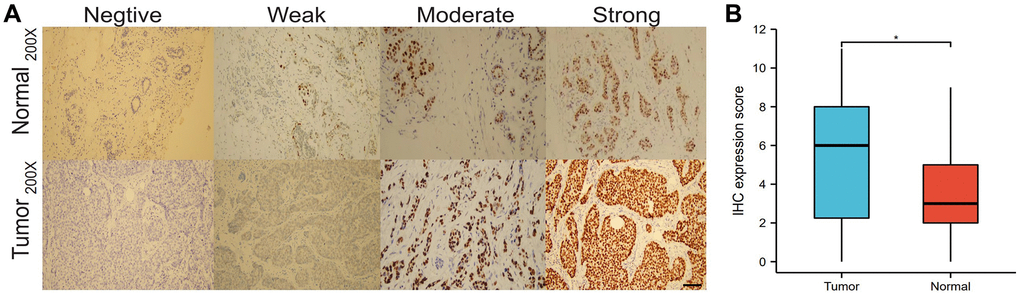
Figure 5.
IHC expression of HNRNPA2B1.
IHC expression of HNRNPA2B1 in normal and tumor tissues (
A
), and box-plot showed IHC expression score between tumor and normal (
B
). (
*
P
< 0.05;
**
P
< 0.01;
***
P
< 0.001).