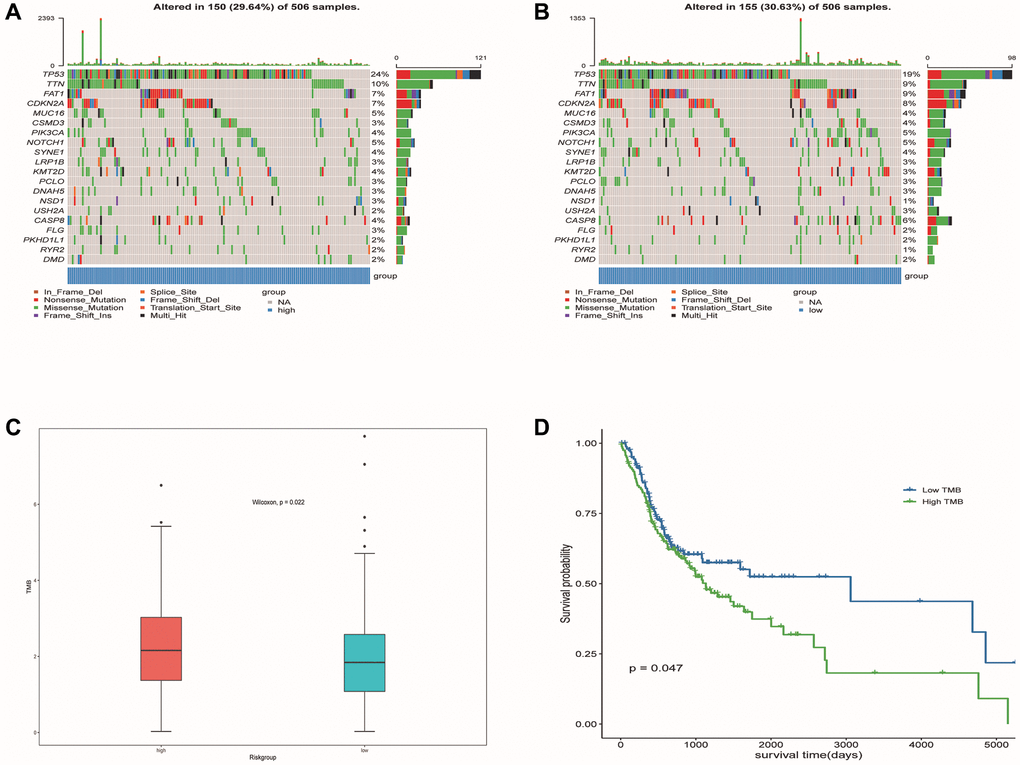
Figure 13.Mutation profiled of low-risk and high-risk populations and TMB associated with model and OS. (A) Mutation status of the high-risk population. (B) Mutation status of the low-risk population. (C) TMB associated with model based on DE-ERSs. (D) TMB associated with OS of OSCC samples.