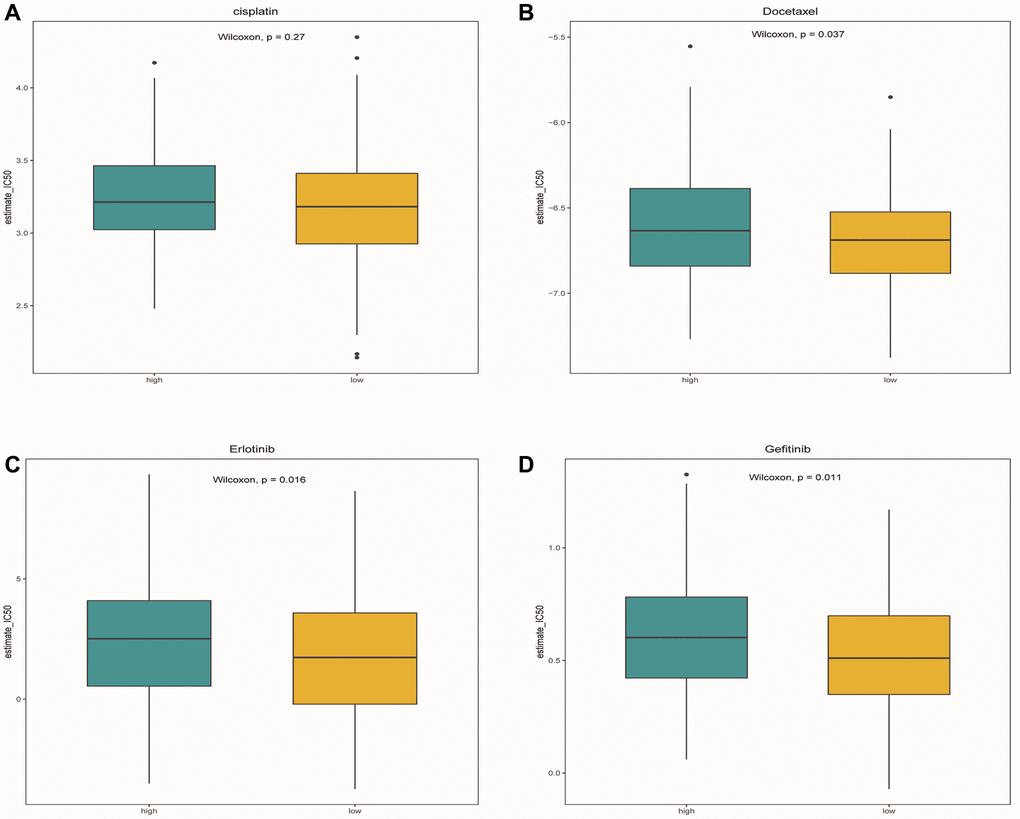
Figure 12.Drug sensitivity analysis. (A–D) Box plots showed the differences in IC50 of cisplatin, docetaxel, Gefitinib and erlotinib between the high-risk group and the low-risk group, respectively. Green represented the high-risk group, while yellow represented the low-risk group.