Submit an Article
Navigate
Home
Editorial Board
Editorial Policies
Current Volume
Archive
Scientific Integrity
Publication Ethics Statements
Interviews with Outstanding Authors
Newsroom
Sponsored Conferences
Podcast
Contact
Special Collections
Submit an Article
Online ISSN: 1945-4589
Research Paper
|
Volume 15, Issue 18
|
pp. 9408–9425
A cellular senescence-related genes model allows for prognosis and treatment stratification of cervical cancer: a bioinformatics analysis and external verification
Back to article
Figure 2
(2 of 9)
−
100%
+
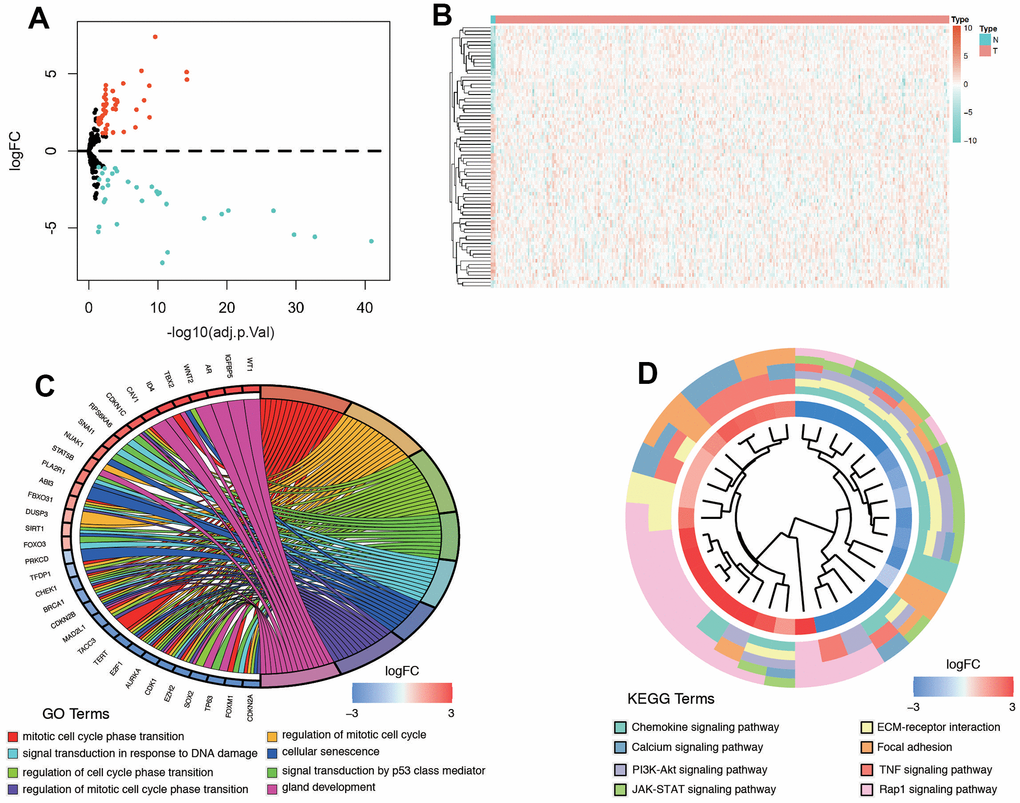
Figure 2.
Differentially expressed senescence-related genes and functional analysis in cervical cancer.
(
A
) Volcano plot. (
B
) Heatmap. (
C
) GO analysis of DEGs. (
D
) KEGG analysis.