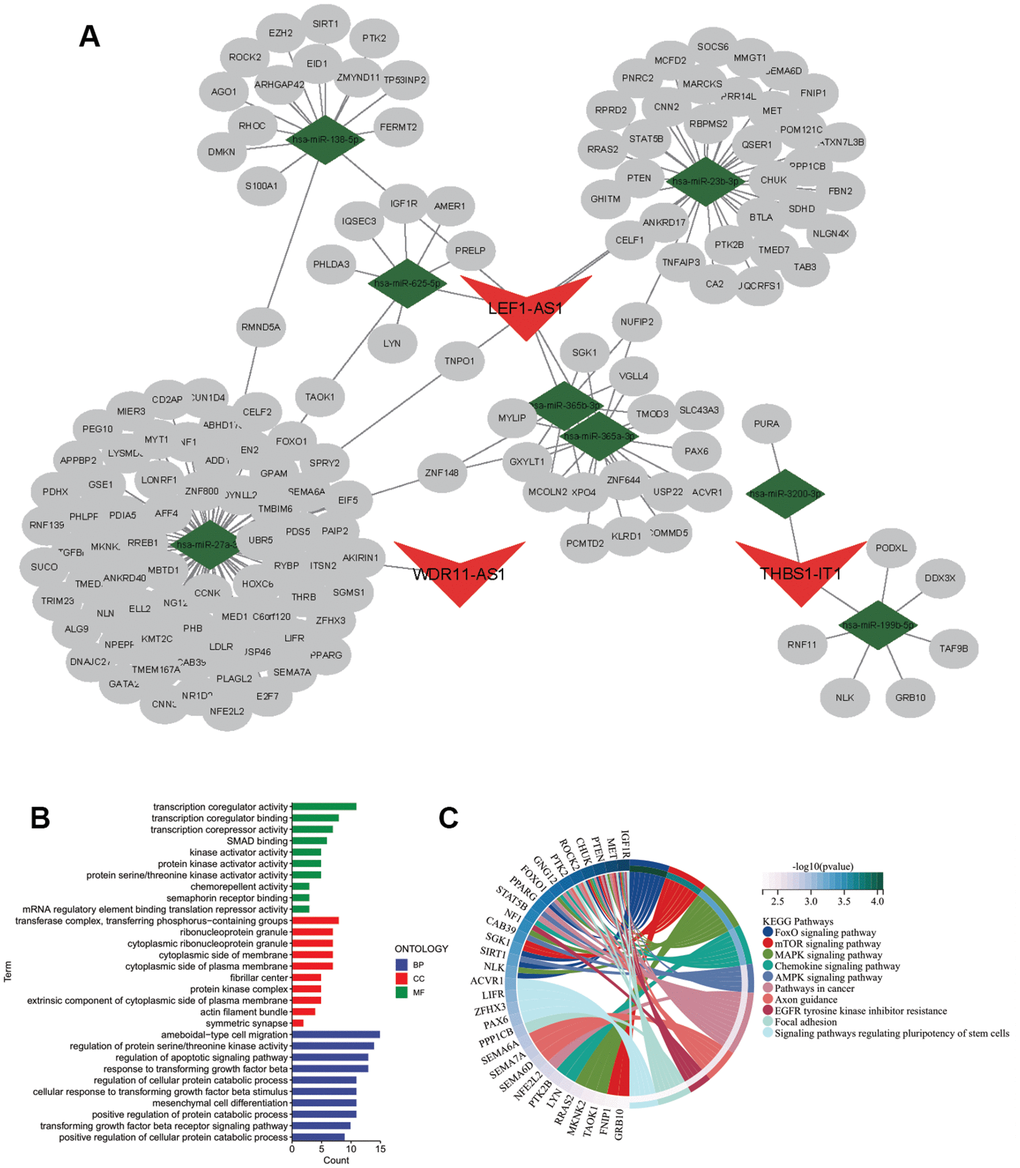
Figure 2.Regulatory network of CarLnc-miRNA-mRNA. (A) Visualization of CarLnc-miRNA-mRNA network by Cytoscape; (B) The top GO terms of the 148 mRNAs within the network by gene enrichment analysis; (C) The top enriched pathways of 148 mRNAs by KEGG enrichment analysis.