Submit an Article
Navigate
Home
Editorial Board
Editorial Policies
Current Volume
Archive
Scientific Integrity
Publication Ethics Statements
Interviews with Outstanding Authors
Newsroom
Sponsored Conferences
Podcast
Contact
Special Collections
Submit an Article
Online ISSN: 1945-4589
Research Paper
|
Volume 15, Issue 14
|
pp. 7278–7307
Active components and molecular mechanisms of Sagacious Confucius’ Pillow Elixir to treat cognitive impairment based on systems pharmacology
Back to article
Figure 8
(8 of 14)
−
100%
+
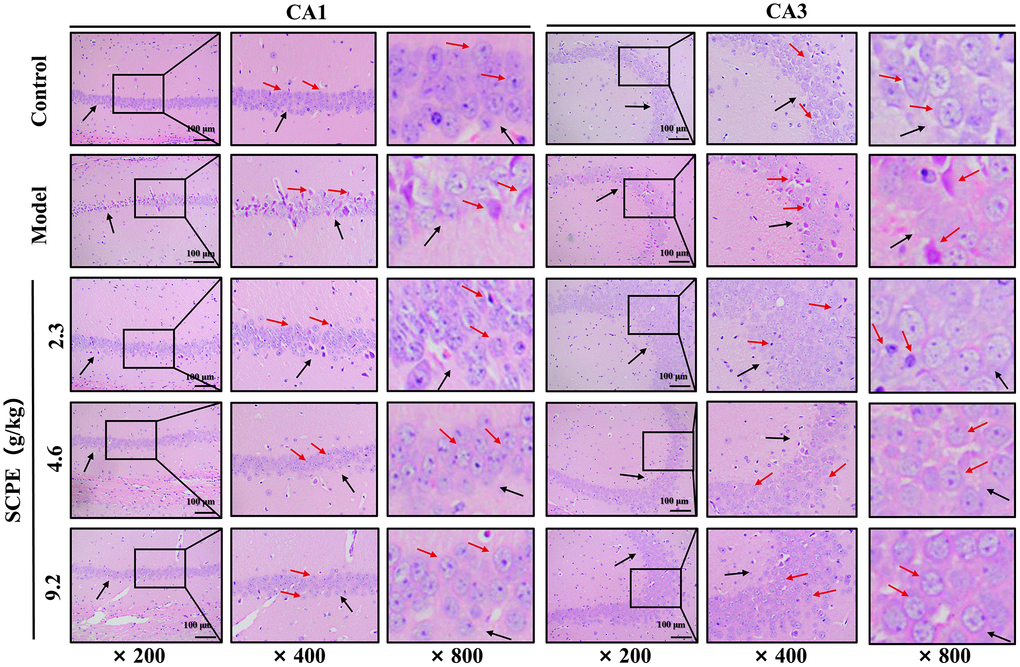
Figure 8.
HE staining of the hippocampal CA1 and CA3 regions (
n
= 3).
The black arrows show the arrangement of pyramidal cells and intercellular space. The red arrows show the morphology of the neuron.