Submit an Article
Navigate
Home
Editorial Board
Editorial Policies
Current Volume
Archive
Scientific Integrity
Publication Ethics Statements
Interviews with Outstanding Authors
Newsroom
Sponsored Conferences
Podcast
Contact
Special Collections
Submit an Article
Online ISSN: 1945-4589
Research Paper
|
Volume 15, Issue 14
|
pp. 7237–7257
Non-SMC condensin I complex subunit D2 (NCAPD2) reveals its prognostic and immunologic features in human cancers
Back to article
Figure 5
(5 of 12)
−
100%
+
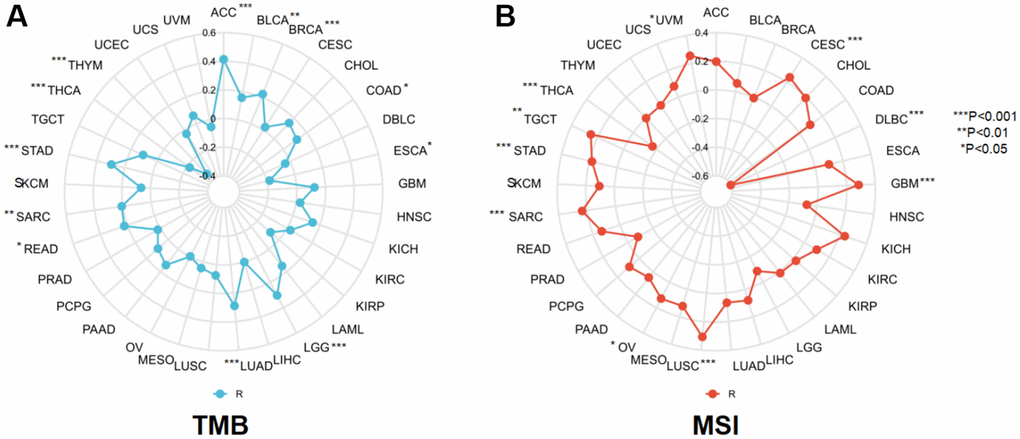
Figure 5.
The correlation between NCAPD2 and (
A
) TMB and (
B
) MSI in pan-cancer. (***
P
< 0.001,**
P
< 0.01,*
P
< 0.05).