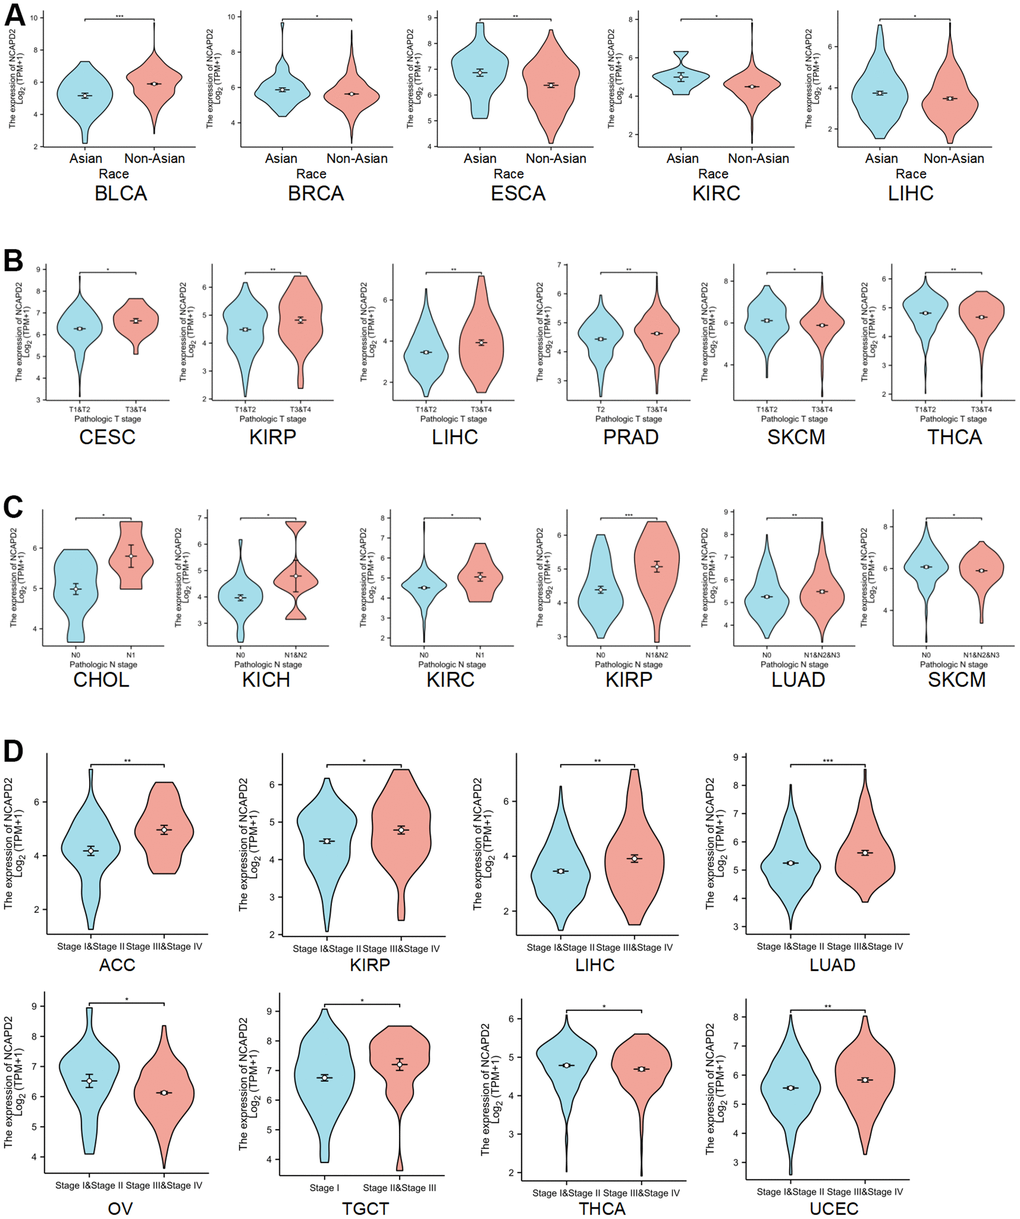
Figure 2.Correlation between NCAPD2 expression and clinical features. (A) The correlation between NCAPD2 expression and race. (B) The correlation between NCAPD2 expression and T stage. (C) The correlation between NCAPD2 expression and N stage. (D) The correlation between NCAPD2 expression and clinical stage. (***P < 0.001,**P < 0.01,*P < 0.05).