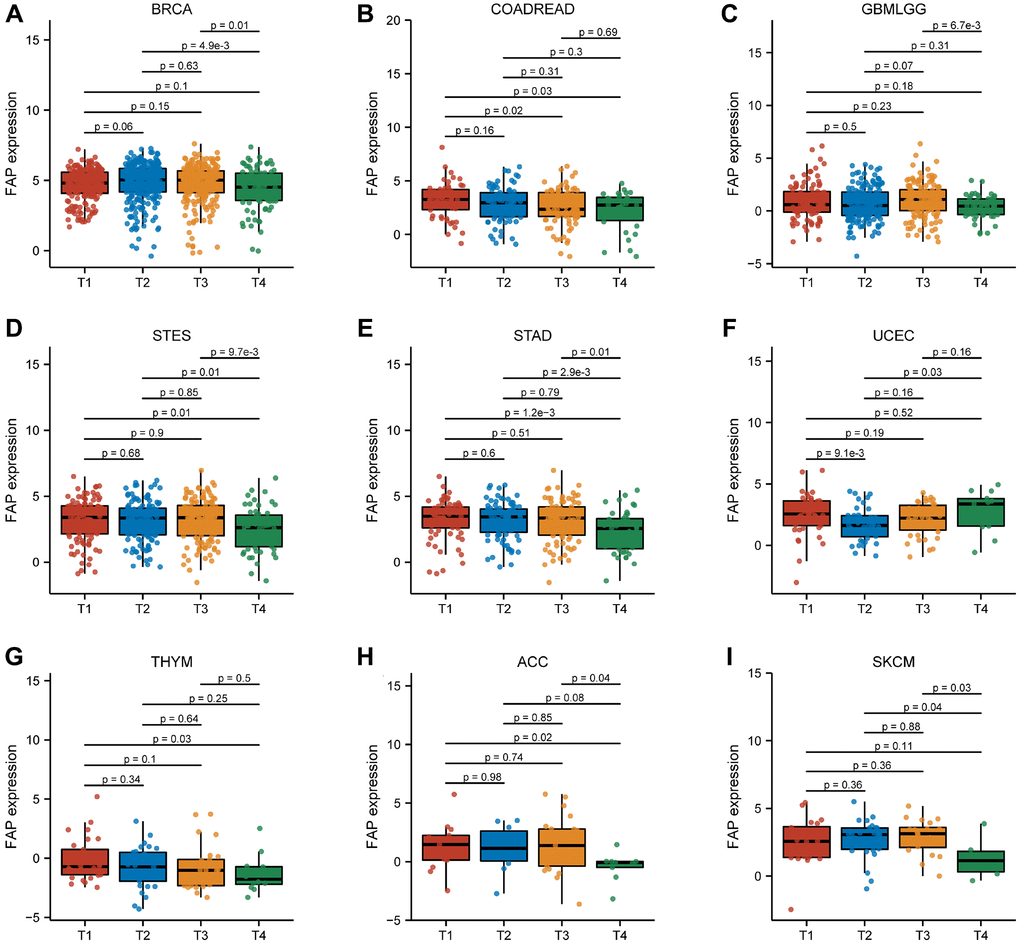
Figure 6.Association between FAP expression and T stage in (A) breast invasive carcinoma (BRCA), (B) colon adenocarcinoma/rectum adenocarcinoma esophageal carcinoma (COADREAD), (C) glioma (GBMLGG), (D) stomach and esophageal carcinoma (STES), (E) stomach adenocarcinoma (STAD), (F) uterine corpus endometrial carcinoma (UCEC), (G) thymoma (THYM), (H) adrenocortical carcinoma (ACC), (I) skin cutaneous melanoma (SKCM).