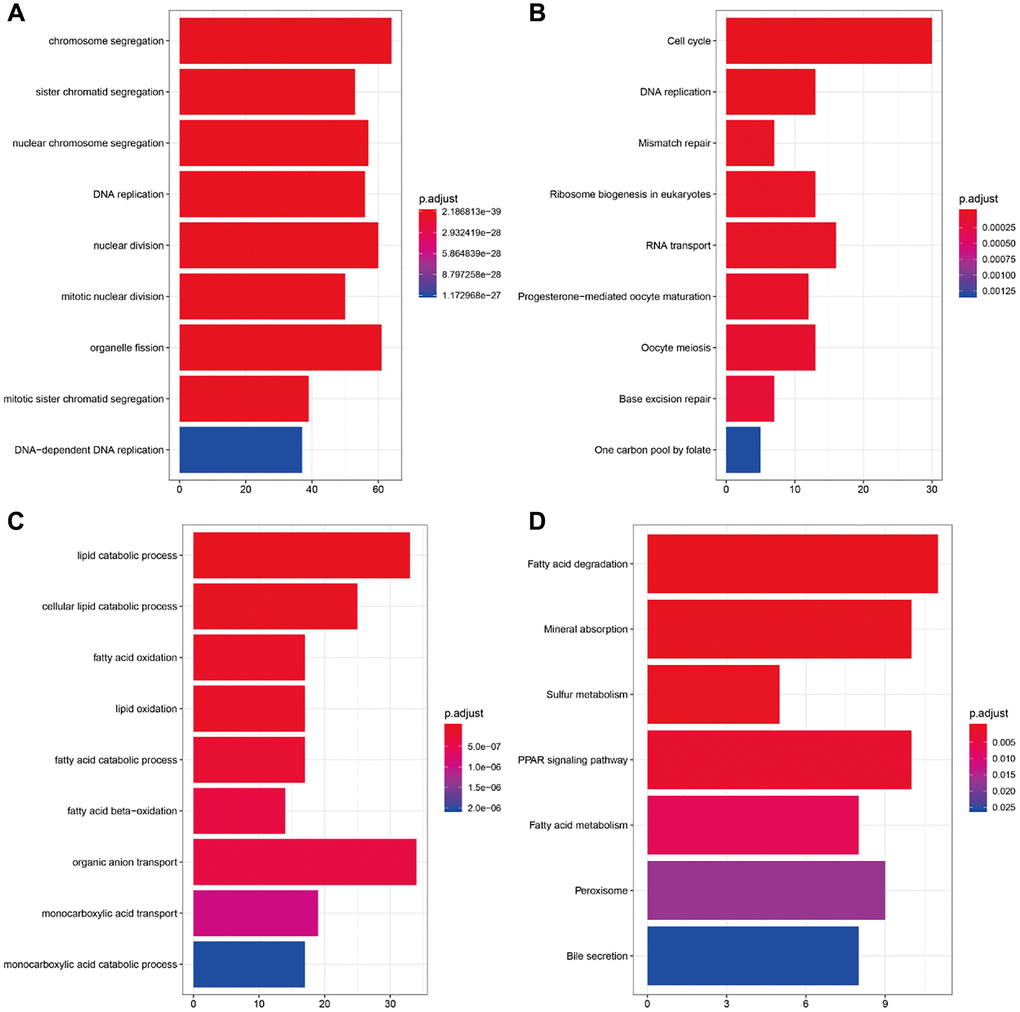
Figure 8.Enrichment analysis of brown and blue modules. (A) GO analysis of all genes in brown modules. (B) KEGG pathway analysis of all genes in brown modules. (C) GO analysis of all genes in blue modules. (D) KEGG pathway analysis of all genes in blue modules.