Submit an Article
Navigate
Home
Editorial Board
Editorial Policies
Current Volume
Archive
Scientific Integrity
Publication Ethics Statements
Interviews with Outstanding Authors
Newsroom
Sponsored Conferences
Podcast
Contact
Special Collections
Submit an Article
Online ISSN: 1945-4589
Research Paper
|
Volume 15, Issue 14
|
pp. 7008–7022
KNTC1 and MCM2 are the molecular targets of gallbladder cancer
Back to article
Figure 9
(9 of 10)
−
100%
+
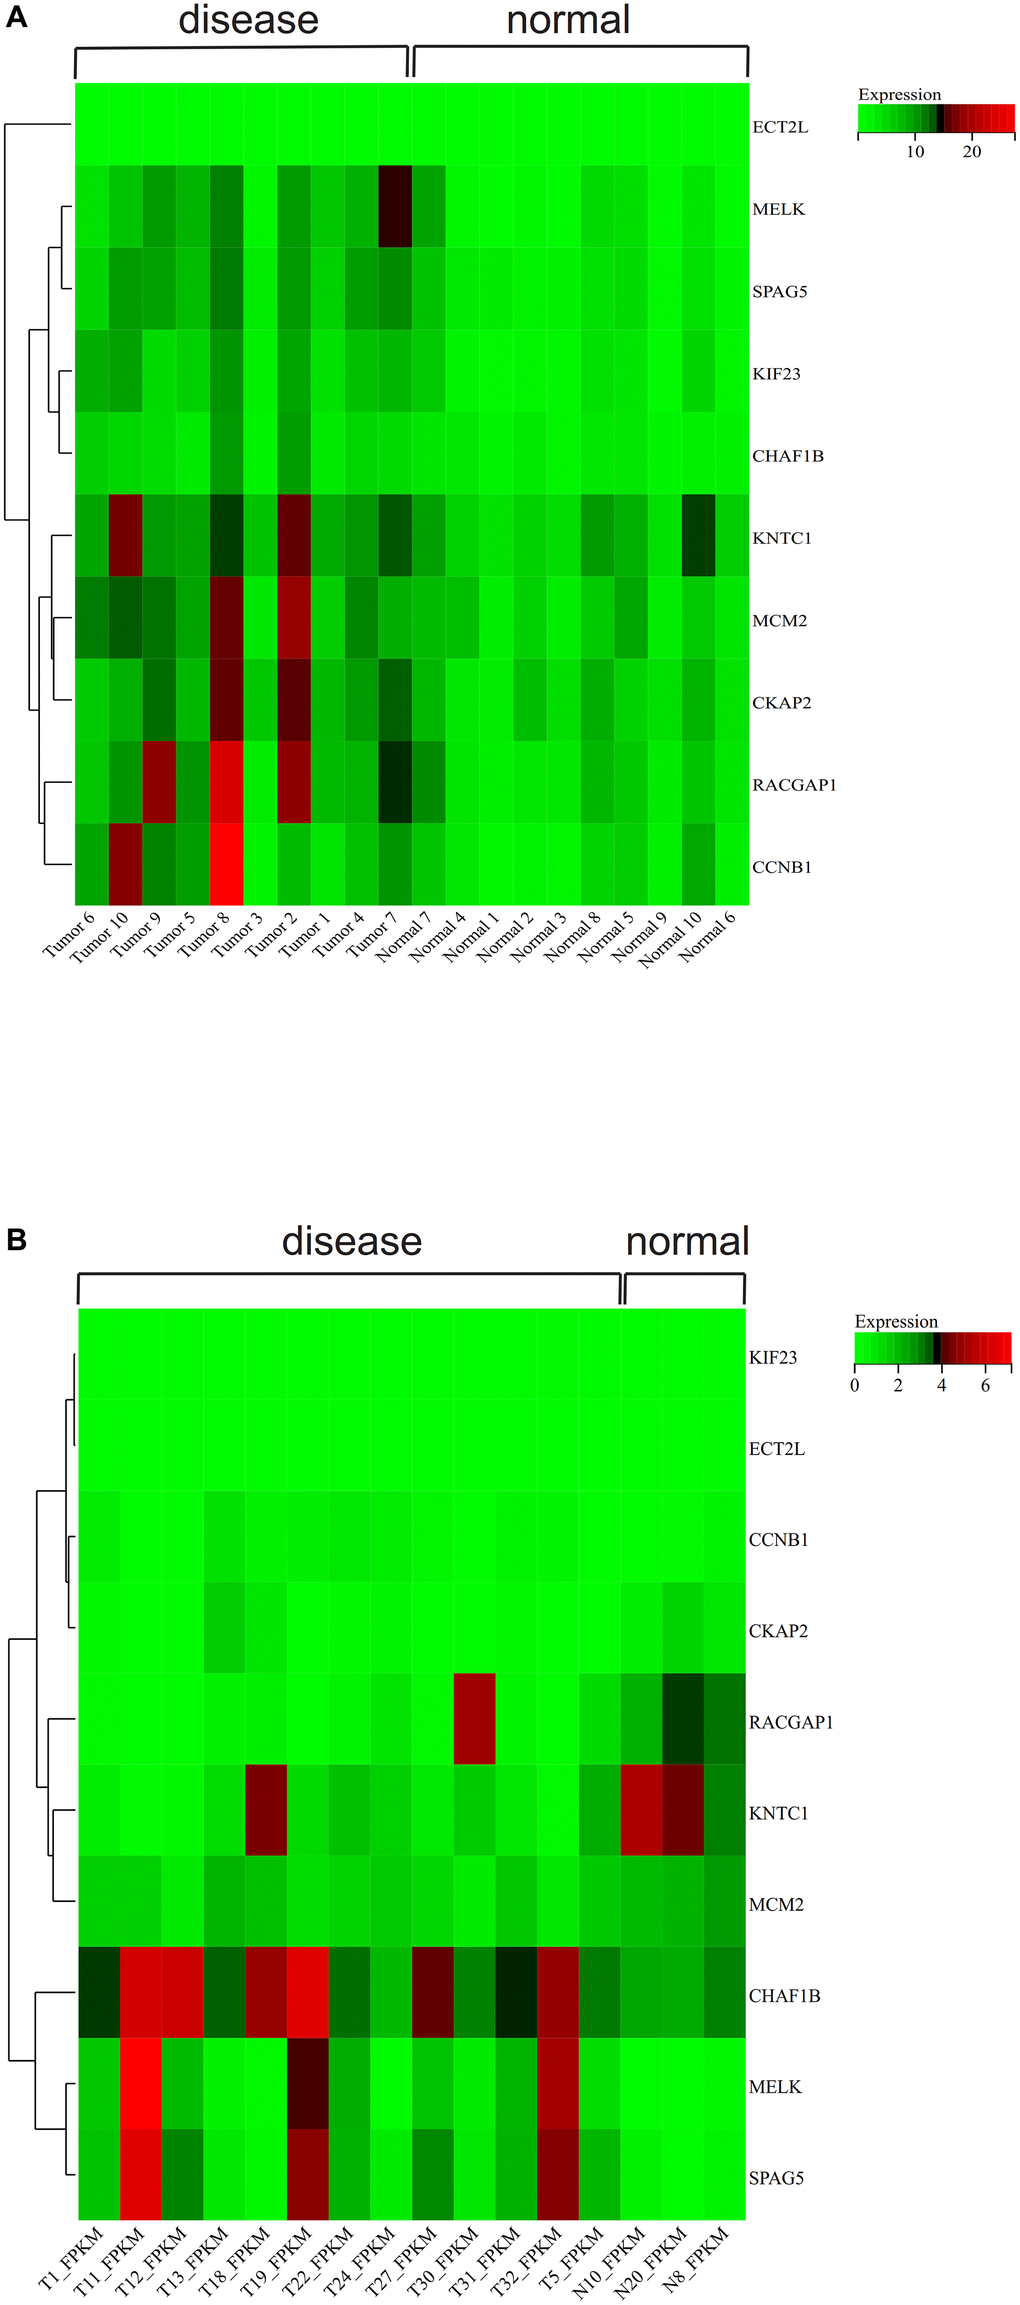
Figure 9.
>Gene expression heat map.
(
A
) GSE139682 and (
B
) GSE202479.