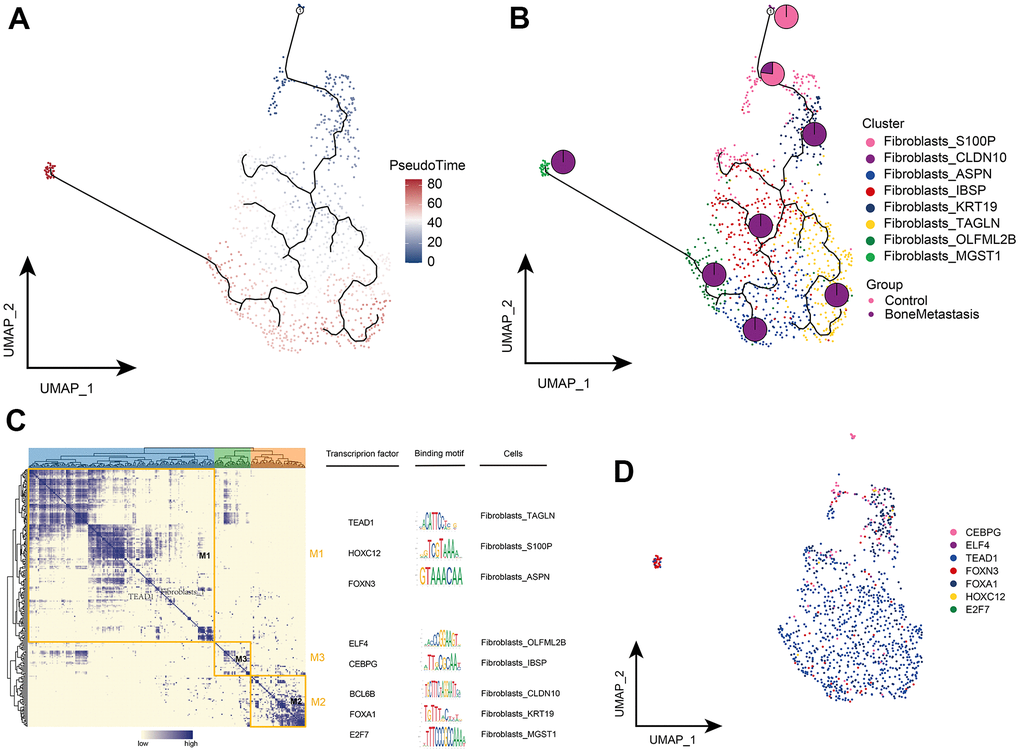
Figure 5.Clonal evolution of fibroblast subpopulations in patients with bone metastases from breast cancer. (A, B) Pseudo-time values (A) and developmental trajectories (B) of fibroblast subpopulations, with pie charts representing the proportion of fibroblast subpopulations in control and breast cancer bone metastasis patients. (C) Co-expression modules of transcription factors in fibroblast subpopulations of patients with breast cancer bone metastases. Left: Identification of regulator modules based on the regulator’s linkage specificity index matrix. Middle: representative transcription factors and their binding patterns in the modules. Right panel: cell subpopulations in which transcription factors are located. (D) Single-cell atlas showing transcription factors regulating fibroblast subpopulations.