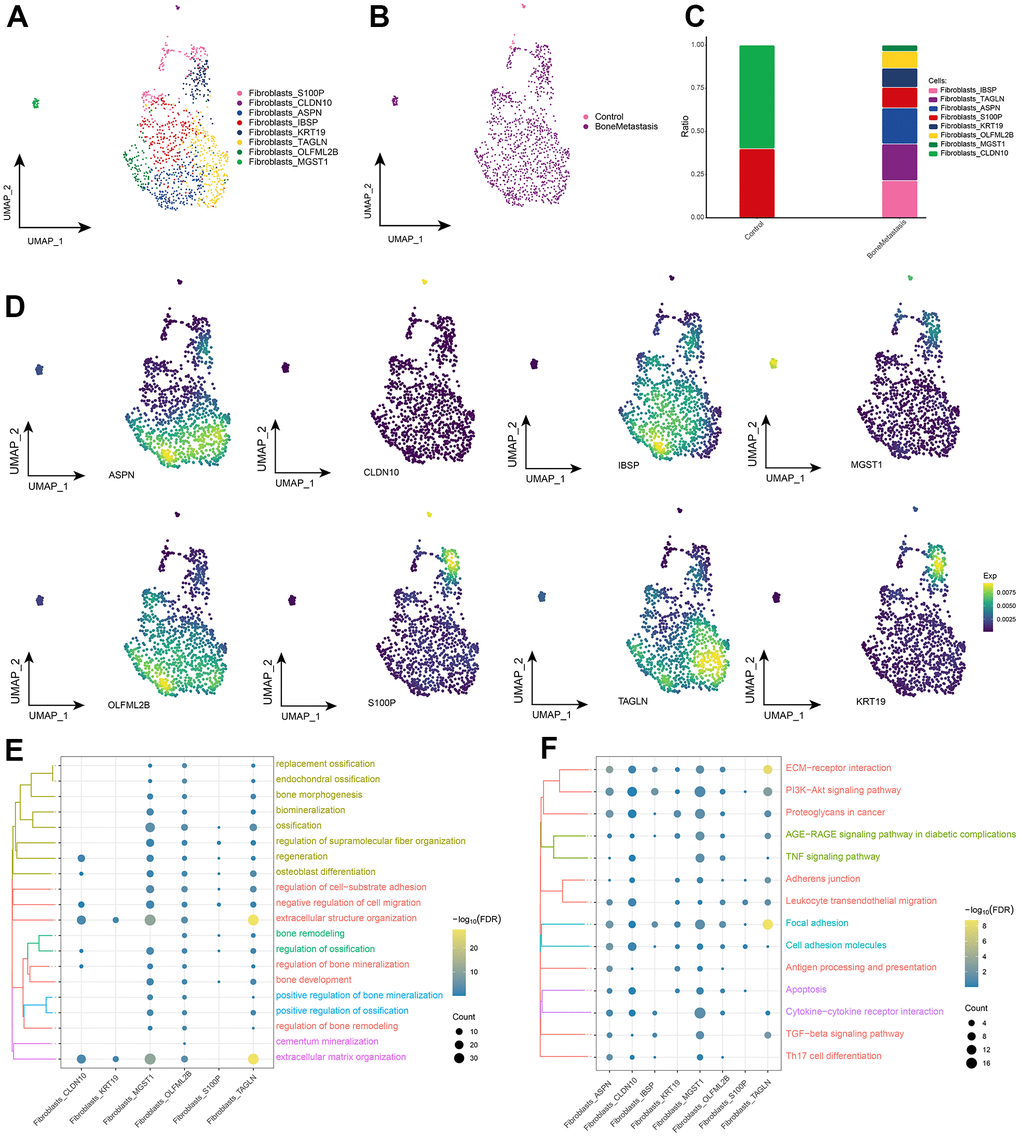
Figure 4.Fibroblast subpopulations in patients with bone metastases from breast cancer. (A) Single-cell atlas showing fibroblast subpopulations. (B) Single-cell atlas showing fibroblast subpopulations in control and breast cancer bone metastasis patients. (C) Differences in abundance of fibroblast subpopulations in control and breast cancer bone metastasis patients. (D) Marker genes specifically and highly expressed in subpopulations of fibroblast subpopulations. (E, F). Biological processes (E) and signaling pathways (F) that enrich fibroblast subpopulations.