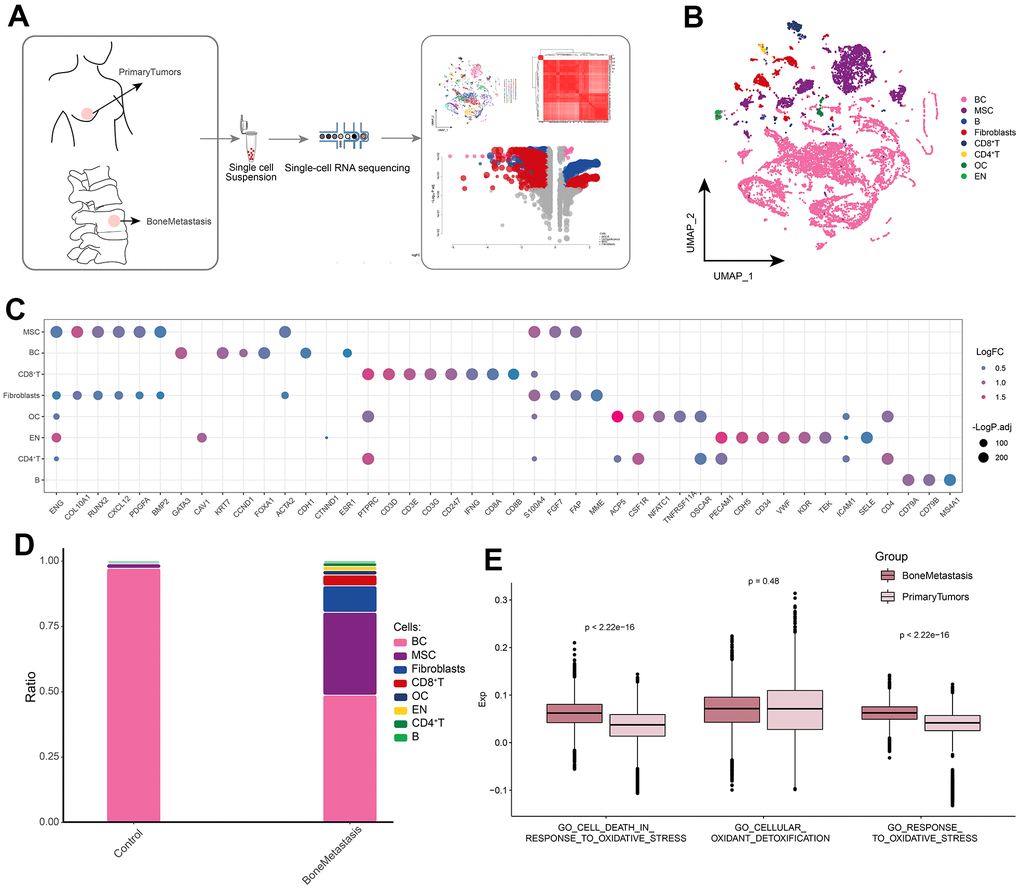
Figure 1.Global single-cell landscape of patients with bone metastases from breast cancer. (A) Flow chart underlying this study. Primary tumors were used as controls in the follow-up study. (B) Single-cell atlas mapping cell types. (C) Cell marker genes for annotation. (D) Differences in cell abundance between control and breast cancer bone metastasis patients. (E) Comparison of differences in single-cell oxidative stress levels between control and bone metastasis samples.