Submit an Article
Navigate
Home
Editorial Board
Editorial Policies
Current Volume
Archive
Scientific Integrity
Publication Ethics Statements
Interviews with Outstanding Authors
Newsroom
Sponsored Conferences
Podcast
Contact
Special Collections
Submit an Article
Online ISSN: 1945-4589
Research Paper
|
Volume 15, Issue 13
|
pp. 6545–6576
Comprehensive prognostic and immunological analysis of Ubiquitin Specific Peptidase 28 in pan-cancers and identification of its role in hepatocellular carcinoma cell lines
Back to article
Figure 6
(6 of 10)
−
100%
+
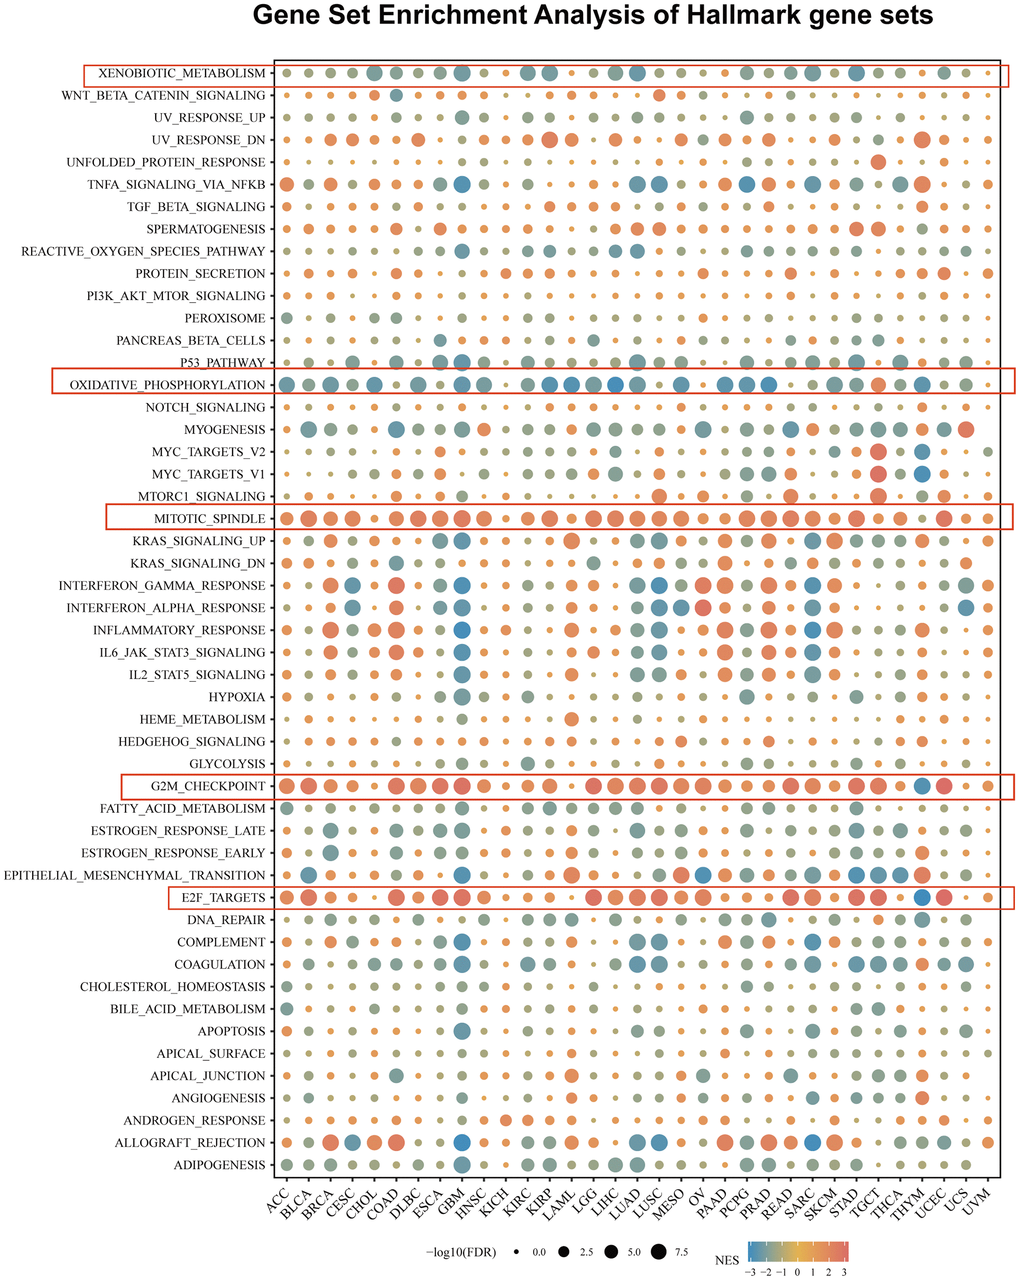
Figure 6.
The hallmarks gene set enrichment analysis (GSEA) of USP28 in pan-cancer.
The circle size represents the FDR value of the enriching term in each cancer, and the color indicates each term’s normalized enrichment score (NES).