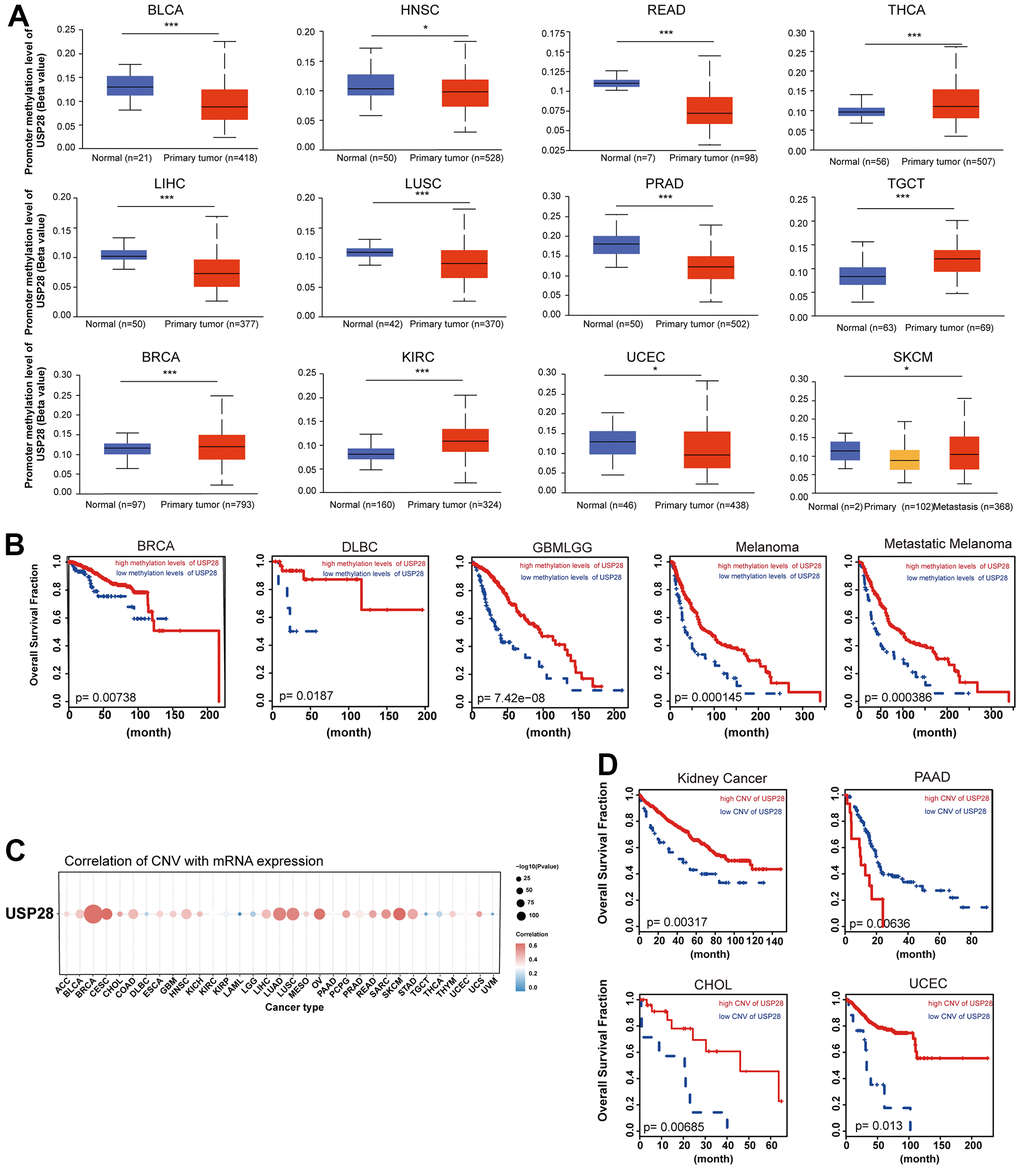
Figure 5.Correlation and prognosis analysis with methylation profile and CNV. (A) Boxplots showing differential USP28 methylation levels between tumor and adjacent normal tissues across the TCGA database. (B) Kaplan-Meier curves of overall survival differences between TCGA cancer cohorts with high methylation levels and those with low methylation levels of USP28. Only TCGA cancers with statistically significant differences between cohorts were presented. (C) The heatmap exhibiting association between USP28 CNV and mRNA expression in various cancers. (D) Kaplan-Meier curves of overall survival differences between TCGA cancer cohorts with high CNV levels and those with low CNV levels of USP28. *p < 0.05; ** p < 0.01; *** p < 0.001.