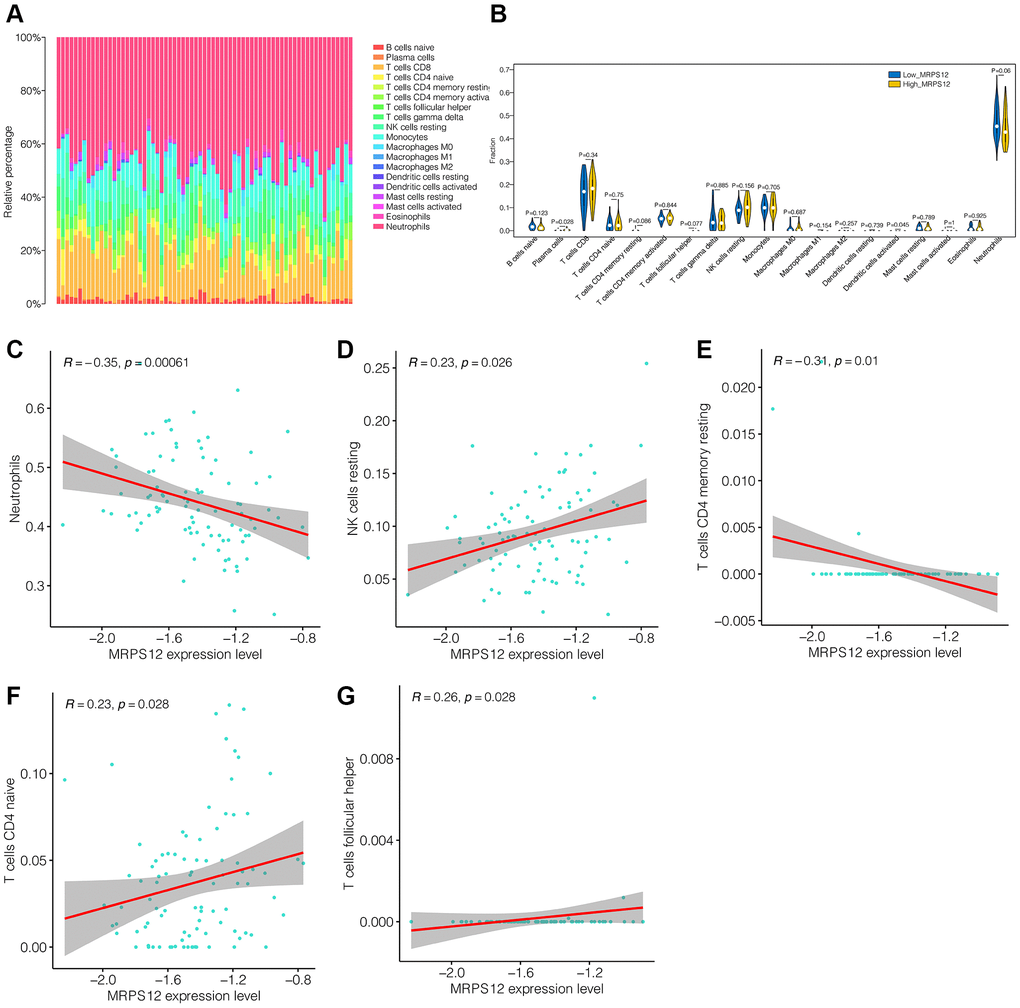
Figure 6.Immune cell infiltration analysis. (A) The immune infiltration landscape in ischemic stroke patients. (B) The infiltration levels of immune cells difference between the high-MRPS12 expression group and low-MRPS12 expression group. (C–G) Correlation analysis of the immune cells associated with MRPS12.